Immigrants from Austria vs Immigrants from Morocco Female Unemployment
COMPARE
Immigrants from Austria
Immigrants from Morocco
Female Unemployment
Female Unemployment Comparison
Immigrants from Austria
Immigrants from Morocco
5.0%
FEMALE UNEMPLOYMENT
95.7/ 100
METRIC RATING
93rd/ 347
METRIC RANK
5.3%
FEMALE UNEMPLOYMENT
47.4/ 100
METRIC RATING
177th/ 347
METRIC RANK
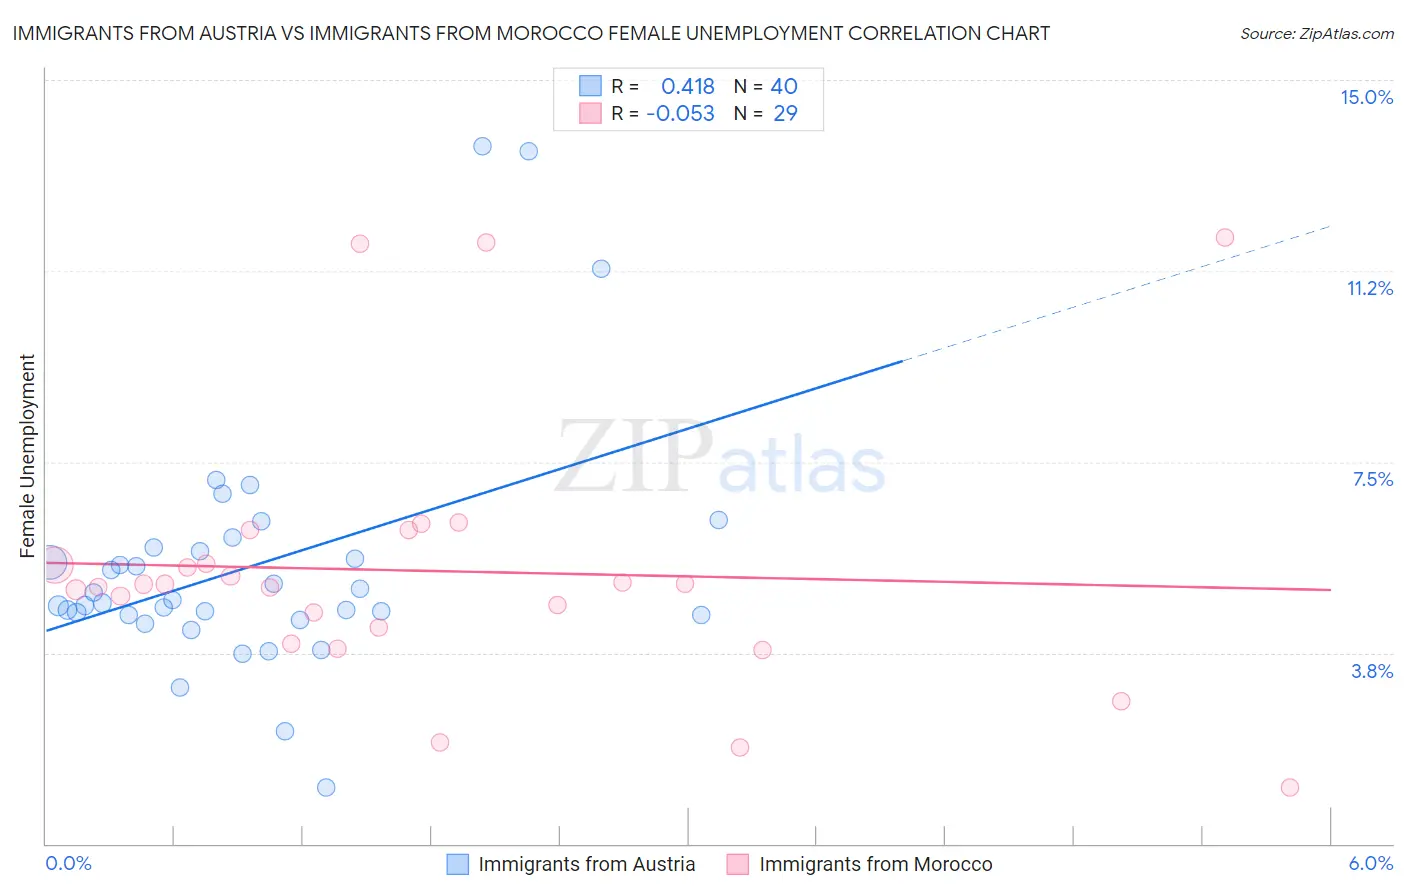
Immigrants from Austria vs Immigrants from Morocco Female Unemployment Correlation Chart
The statistical analysis conducted on geographies consisting of 167,645,945 people shows a moderate positive correlation between the proportion of Immigrants from Austria and unemploymnet rate among females in the United States with a correlation coefficient (R) of 0.418 and weighted average of 5.0%. Similarly, the statistical analysis conducted on geographies consisting of 178,730,961 people shows a slight negative correlation between the proportion of Immigrants from Morocco and unemploymnet rate among females in the United States with a correlation coefficient (R) of -0.053 and weighted average of 5.3%, a difference of 5.1%.
Female Unemployment Correlation Summary
| Measurement | Immigrants from Austria | Immigrants from Morocco |
| Minimum | 1.1% | 1.1% |
| Maximum | 13.7% | 11.9% |
| Range | 12.6% | 10.8% |
| Mean | 5.5% | 5.4% |
| Median | 4.8% | 5.1% |
| Interquartile 25% (IQ1) | 4.5% | 4.1% |
| Interquartile 75% (IQ3) | 5.8% | 5.8% |
| Interquartile Range (IQR) | 1.3% | 1.7% |
| Standard Deviation (Sample) | 2.5% | 2.6% |
| Standard Deviation (Population) | 2.4% | 2.5% |
Similar Demographics by Female Unemployment
Demographics Similar to Immigrants from Austria by Female Unemployment
In terms of female unemployment, the demographic groups most similar to Immigrants from Austria are Immigrants from Malaysia (5.0%, a difference of 0.020%), Burmese (5.0%, a difference of 0.040%), Romanian (5.0%, a difference of 0.080%), Immigrants from South Central Asia (5.0%, a difference of 0.090%), and Immigrants from Japan (5.0%, a difference of 0.10%).
| Demographics | Rating | Rank | Female Unemployment |
| Bolivians | 97.1 /100 | #86 | Exceptional 5.0% |
| Venezuelans | 96.9 /100 | #87 | Exceptional 5.0% |
| Immigrants | Sudan | 96.7 /100 | #88 | Exceptional 5.0% |
| Immigrants | Taiwan | 96.6 /100 | #89 | Exceptional 5.0% |
| Immigrants | Sweden | 96.3 /100 | #90 | Exceptional 5.0% |
| Immigrants | Japan | 96.0 /100 | #91 | Exceptional 5.0% |
| Romanians | 95.9 /100 | #92 | Exceptional 5.0% |
| Immigrants | Austria | 95.7 /100 | #93 | Exceptional 5.0% |
| Immigrants | Malaysia | 95.7 /100 | #94 | Exceptional 5.0% |
| Burmese | 95.6 /100 | #95 | Exceptional 5.0% |
| Immigrants | South Central Asia | 95.5 /100 | #96 | Exceptional 5.0% |
| Immigrants | Somalia | 95.2 /100 | #97 | Exceptional 5.0% |
| Immigrants | Kuwait | 95.2 /100 | #98 | Exceptional 5.0% |
| Immigrants | Zaire | 95.2 /100 | #99 | Exceptional 5.0% |
| Indonesians | 95.1 /100 | #100 | Exceptional 5.0% |
Demographics Similar to Immigrants from Morocco by Female Unemployment
In terms of female unemployment, the demographic groups most similar to Immigrants from Morocco are Immigrants from Vietnam (5.3%, a difference of 0.0%), Immigrants from Laos (5.3%, a difference of 0.010%), Immigrants from Southern Europe (5.3%, a difference of 0.070%), Laotian (5.3%, a difference of 0.14%), and Immigrants from Poland (5.3%, a difference of 0.16%).
| Demographics | Rating | Rank | Female Unemployment |
| Spanish | 55.9 /100 | #170 | Average 5.2% |
| Immigrants | Denmark | 55.0 /100 | #171 | Average 5.2% |
| Immigrants | Uganda | 50.7 /100 | #172 | Average 5.3% |
| Iranians | 50.4 /100 | #173 | Average 5.3% |
| Immigrants | Poland | 50.0 /100 | #174 | Average 5.3% |
| Immigrants | Laos | 47.5 /100 | #175 | Average 5.3% |
| Immigrants | Vietnam | 47.5 /100 | #176 | Average 5.3% |
| Immigrants | Morocco | 47.4 /100 | #177 | Average 5.3% |
| Immigrants | Southern Europe | 46.2 /100 | #178 | Average 5.3% |
| Laotians | 45.1 /100 | #179 | Average 5.3% |
| Immigrants | Congo | 43.1 /100 | #180 | Average 5.3% |
| Taiwanese | 42.7 /100 | #181 | Average 5.3% |
| Immigrants | Nonimmigrants | 42.6 /100 | #182 | Average 5.3% |
| Immigrants | Indonesia | 40.7 /100 | #183 | Average 5.3% |
| Immigrants | Ukraine | 40.1 /100 | #184 | Average 5.3% |