Immigrants from Austria vs Immigrants from Bosnia and Herzegovina Female Unemployment
COMPARE
Immigrants from Austria
Immigrants from Bosnia and Herzegovina
Female Unemployment
Female Unemployment Comparison
Immigrants from Austria
Immigrants from Bosnia and Herzegovina
5.0%
FEMALE UNEMPLOYMENT
95.7/ 100
METRIC RATING
93rd/ 347
METRIC RANK
4.7%
FEMALE UNEMPLOYMENT
99.9/ 100
METRIC RATING
26th/ 347
METRIC RANK
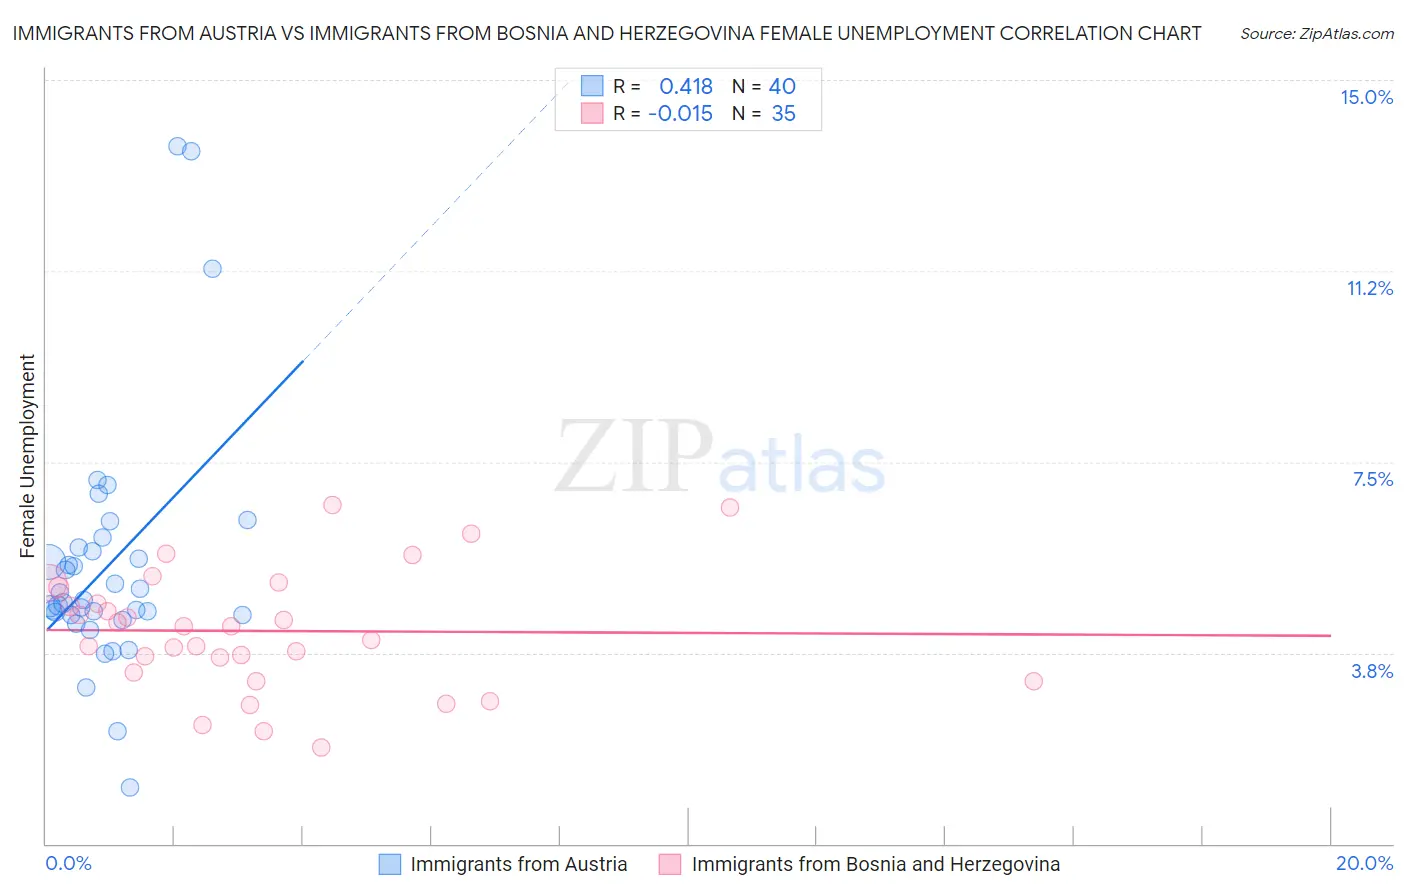
Immigrants from Austria vs Immigrants from Bosnia and Herzegovina Female Unemployment Correlation Chart
The statistical analysis conducted on geographies consisting of 167,645,945 people shows a moderate positive correlation between the proportion of Immigrants from Austria and unemploymnet rate among females in the United States with a correlation coefficient (R) of 0.418 and weighted average of 5.0%. Similarly, the statistical analysis conducted on geographies consisting of 156,582,357 people shows no correlation between the proportion of Immigrants from Bosnia and Herzegovina and unemploymnet rate among females in the United States with a correlation coefficient (R) of -0.015 and weighted average of 4.7%, a difference of 6.0%.
Female Unemployment Correlation Summary
| Measurement | Immigrants from Austria | Immigrants from Bosnia and Herzegovina |
| Minimum | 1.1% | 1.9% |
| Maximum | 13.7% | 6.6% |
| Range | 12.6% | 4.7% |
| Mean | 5.5% | 4.2% |
| Median | 4.8% | 4.3% |
| Interquartile 25% (IQ1) | 4.5% | 3.4% |
| Interquartile 75% (IQ3) | 5.8% | 5.0% |
| Interquartile Range (IQR) | 1.3% | 1.7% |
| Standard Deviation (Sample) | 2.5% | 1.2% |
| Standard Deviation (Population) | 2.4% | 1.2% |
Similar Demographics by Female Unemployment
Demographics Similar to Immigrants from Austria by Female Unemployment
In terms of female unemployment, the demographic groups most similar to Immigrants from Austria are Immigrants from Malaysia (5.0%, a difference of 0.020%), Burmese (5.0%, a difference of 0.040%), Romanian (5.0%, a difference of 0.080%), Immigrants from South Central Asia (5.0%, a difference of 0.090%), and Immigrants from Japan (5.0%, a difference of 0.10%).
| Demographics | Rating | Rank | Female Unemployment |
| Bolivians | 97.1 /100 | #86 | Exceptional 5.0% |
| Venezuelans | 96.9 /100 | #87 | Exceptional 5.0% |
| Immigrants | Sudan | 96.7 /100 | #88 | Exceptional 5.0% |
| Immigrants | Taiwan | 96.6 /100 | #89 | Exceptional 5.0% |
| Immigrants | Sweden | 96.3 /100 | #90 | Exceptional 5.0% |
| Immigrants | Japan | 96.0 /100 | #91 | Exceptional 5.0% |
| Romanians | 95.9 /100 | #92 | Exceptional 5.0% |
| Immigrants | Austria | 95.7 /100 | #93 | Exceptional 5.0% |
| Immigrants | Malaysia | 95.7 /100 | #94 | Exceptional 5.0% |
| Burmese | 95.6 /100 | #95 | Exceptional 5.0% |
| Immigrants | South Central Asia | 95.5 /100 | #96 | Exceptional 5.0% |
| Immigrants | Somalia | 95.2 /100 | #97 | Exceptional 5.0% |
| Immigrants | Kuwait | 95.2 /100 | #98 | Exceptional 5.0% |
| Immigrants | Zaire | 95.2 /100 | #99 | Exceptional 5.0% |
| Indonesians | 95.1 /100 | #100 | Exceptional 5.0% |
Demographics Similar to Immigrants from Bosnia and Herzegovina by Female Unemployment
In terms of female unemployment, the demographic groups most similar to Immigrants from Bosnia and Herzegovina are Immigrants from India (4.7%, a difference of 0.040%), Welsh (4.7%, a difference of 0.13%), British (4.7%, a difference of 0.17%), Irish (4.7%, a difference of 0.20%), and Cypriot (4.7%, a difference of 0.20%).
| Demographics | Rating | Rank | Female Unemployment |
| Poles | 99.9 /100 | #19 | Exceptional 4.7% |
| Bulgarians | 99.9 /100 | #20 | Exceptional 4.7% |
| Fijians | 99.9 /100 | #21 | Exceptional 4.7% |
| Europeans | 99.9 /100 | #22 | Exceptional 4.7% |
| Scottish | 99.9 /100 | #23 | Exceptional 4.7% |
| Welsh | 99.9 /100 | #24 | Exceptional 4.7% |
| Immigrants | India | 99.9 /100 | #25 | Exceptional 4.7% |
| Immigrants | Bosnia and Herzegovina | 99.9 /100 | #26 | Exceptional 4.7% |
| British | 99.9 /100 | #27 | Exceptional 4.7% |
| Irish | 99.9 /100 | #28 | Exceptional 4.7% |
| Cypriots | 99.9 /100 | #29 | Exceptional 4.7% |
| Lithuanians | 99.8 /100 | #30 | Exceptional 4.7% |
| Sudanese | 99.8 /100 | #31 | Exceptional 4.8% |
| Slovaks | 99.8 /100 | #32 | Exceptional 4.8% |
| Czechoslovakians | 99.7 /100 | #33 | Exceptional 4.8% |