Arab vs Immigrants from Morocco Female Unemployment
COMPARE
Arab
Immigrants from Morocco
Female Unemployment
Female Unemployment Comparison
Arabs
Immigrants from Morocco
5.3%
FEMALE UNEMPLOYMENT
27.7/ 100
METRIC RATING
193rd/ 347
METRIC RANK
5.3%
FEMALE UNEMPLOYMENT
47.4/ 100
METRIC RATING
177th/ 347
METRIC RANK
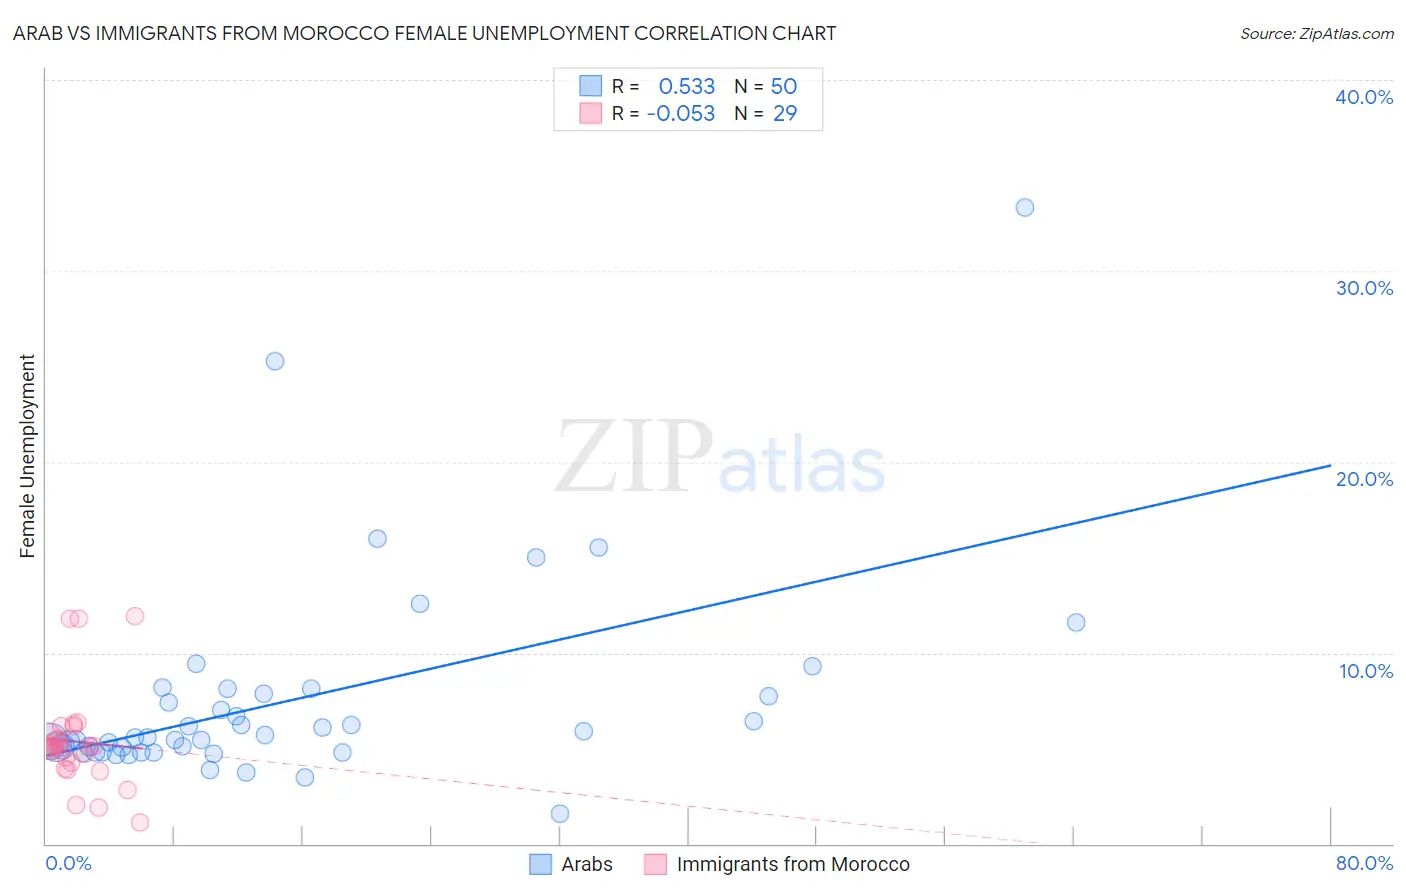
Arab vs Immigrants from Morocco Female Unemployment Correlation Chart
The statistical analysis conducted on geographies consisting of 483,183,943 people shows a substantial positive correlation between the proportion of Arabs and unemploymnet rate among females in the United States with a correlation coefficient (R) of 0.533 and weighted average of 5.3%. Similarly, the statistical analysis conducted on geographies consisting of 178,730,961 people shows a slight negative correlation between the proportion of Immigrants from Morocco and unemploymnet rate among females in the United States with a correlation coefficient (R) of -0.053 and weighted average of 5.3%, a difference of 1.3%.
Female Unemployment Correlation Summary
| Measurement | Arab | Immigrants from Morocco |
| Minimum | 1.6% | 1.1% |
| Maximum | 33.3% | 11.9% |
| Range | 31.7% | 10.8% |
| Mean | 7.5% | 5.4% |
| Median | 5.6% | 5.1% |
| Interquartile 25% (IQ1) | 4.8% | 4.1% |
| Interquartile 75% (IQ3) | 7.8% | 5.8% |
| Interquartile Range (IQR) | 3.0% | 1.7% |
| Standard Deviation (Sample) | 5.4% | 2.6% |
| Standard Deviation (Population) | 5.4% | 2.5% |
Demographics Similar to Arabs and Immigrants from Morocco by Female Unemployment
In terms of female unemployment, the demographic groups most similar to Arabs are Colombian (5.3%, a difference of 0.050%), Portuguese (5.3%, a difference of 0.070%), Immigrants from Colombia (5.3%, a difference of 0.11%), Cherokee (5.3%, a difference of 0.23%), and Ugandan (5.3%, a difference of 0.25%). Similarly, the demographic groups most similar to Immigrants from Morocco are Immigrants from Vietnam (5.3%, a difference of 0.0%), Immigrants from Laos (5.3%, a difference of 0.010%), Immigrants from Southern Europe (5.3%, a difference of 0.070%), Laotian (5.3%, a difference of 0.14%), and Immigrants from Congo (5.3%, a difference of 0.26%).
| Demographics | Rating | Rank | Female Unemployment |
| Immigrants | Laos | 47.5 /100 | #175 | Average 5.3% |
| Immigrants | Vietnam | 47.5 /100 | #176 | Average 5.3% |
| Immigrants | Morocco | 47.4 /100 | #177 | Average 5.3% |
| Immigrants | Southern Europe | 46.2 /100 | #178 | Average 5.3% |
| Laotians | 45.1 /100 | #179 | Average 5.3% |
| Immigrants | Congo | 43.1 /100 | #180 | Average 5.3% |
| Taiwanese | 42.7 /100 | #181 | Average 5.3% |
| Immigrants | Nonimmigrants | 42.6 /100 | #182 | Average 5.3% |
| Immigrants | Indonesia | 40.7 /100 | #183 | Average 5.3% |
| Immigrants | Ukraine | 40.1 /100 | #184 | Average 5.3% |
| Malaysians | 40.1 /100 | #185 | Average 5.3% |
| Immigrants | Belarus | 39.4 /100 | #186 | Fair 5.3% |
| Immigrants | Albania | 35.4 /100 | #187 | Fair 5.3% |
| Afghans | 33.9 /100 | #188 | Fair 5.3% |
| Costa Ricans | 33.8 /100 | #189 | Fair 5.3% |
| Ugandans | 31.2 /100 | #190 | Fair 5.3% |
| Cherokee | 30.8 /100 | #191 | Fair 5.3% |
| Portuguese | 28.6 /100 | #192 | Fair 5.3% |
| Arabs | 27.7 /100 | #193 | Fair 5.3% |
| Colombians | 27.0 /100 | #194 | Fair 5.3% |
| Immigrants | Colombia | 26.2 /100 | #195 | Fair 5.3% |