Immigrants from Armenia vs English Female Unemployment
COMPARE
Immigrants from Armenia
English
Female Unemployment
Female Unemployment Comparison
Immigrants from Armenia
English
7.1%
FEMALE UNEMPLOYMENT
0.0/ 100
METRIC RATING
334th/ 347
METRIC RANK
4.6%
FEMALE UNEMPLOYMENT
100.0/ 100
METRIC RATING
15th/ 347
METRIC RANK
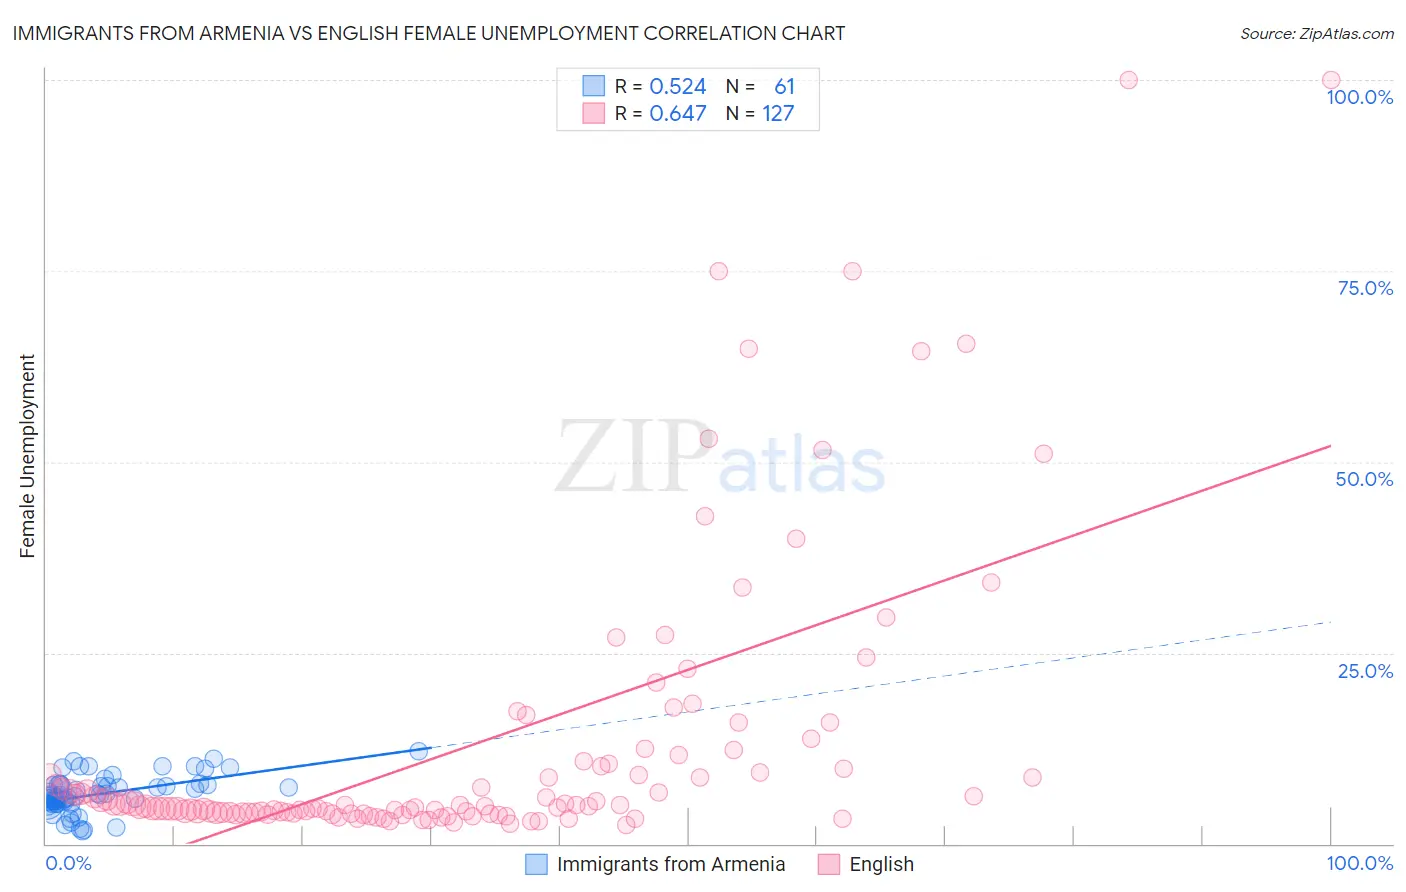
Immigrants from Armenia vs English Female Unemployment Correlation Chart
The statistical analysis conducted on geographies consisting of 97,677,717 people shows a substantial positive correlation between the proportion of Immigrants from Armenia and unemploymnet rate among females in the United States with a correlation coefficient (R) of 0.524 and weighted average of 7.1%. Similarly, the statistical analysis conducted on geographies consisting of 563,002,519 people shows a significant positive correlation between the proportion of English and unemploymnet rate among females in the United States with a correlation coefficient (R) of 0.647 and weighted average of 4.6%, a difference of 52.6%.
Female Unemployment Correlation Summary
| Measurement | Immigrants from Armenia | English |
| Minimum | 1.6% | 2.5% |
| Maximum | 12.1% | 100.0% |
| Range | 10.5% | 97.5% |
| Mean | 6.6% | 12.9% |
| Median | 6.4% | 5.0% |
| Interquartile 25% (IQ1) | 5.4% | 4.1% |
| Interquartile 75% (IQ3) | 7.7% | 10.5% |
| Interquartile Range (IQR) | 2.3% | 6.4% |
| Standard Deviation (Sample) | 2.4% | 19.0% |
| Standard Deviation (Population) | 2.4% | 18.9% |
Similar Demographics by Female Unemployment
Demographics Similar to Immigrants from Armenia by Female Unemployment
In terms of female unemployment, the demographic groups most similar to Immigrants from Armenia are Menominee (7.0%, a difference of 0.41%), Sioux (7.0%, a difference of 0.44%), Dominican (7.2%, a difference of 1.4%), Immigrants from Dominican Republic (7.2%, a difference of 2.1%), and Navajo (7.3%, a difference of 3.0%).
| Demographics | Rating | Rank | Female Unemployment |
| Alaska Natives | 0.0 /100 | #327 | Tragic 6.6% |
| Guyanese | 0.0 /100 | #328 | Tragic 6.7% |
| Immigrants | Guyana | 0.0 /100 | #329 | Tragic 6.7% |
| Yakama | 0.0 /100 | #330 | Tragic 6.7% |
| Paiute | 0.0 /100 | #331 | Tragic 6.8% |
| Sioux | 0.0 /100 | #332 | Tragic 7.0% |
| Menominee | 0.0 /100 | #333 | Tragic 7.0% |
| Immigrants | Armenia | 0.0 /100 | #334 | Tragic 7.1% |
| Dominicans | 0.0 /100 | #335 | Tragic 7.2% |
| Immigrants | Dominican Republic | 0.0 /100 | #336 | Tragic 7.2% |
| Navajo | 0.0 /100 | #337 | Tragic 7.3% |
| Tohono O'odham | 0.0 /100 | #338 | Tragic 7.7% |
| Immigrants | Yemen | 0.0 /100 | #339 | Tragic 7.8% |
| Hopi | 0.0 /100 | #340 | Tragic 8.1% |
| Inupiat | 0.0 /100 | #341 | Tragic 8.2% |
Demographics Similar to English by Female Unemployment
In terms of female unemployment, the demographic groups most similar to English are Finnish (4.6%, a difference of 0.20%), Belgian (4.6%, a difference of 0.79%), Carpatho Rusyn (4.7%, a difference of 0.85%), Croatian (4.7%, a difference of 0.87%), and Dutch (4.6%, a difference of 0.94%).
| Demographics | Rating | Rank | Female Unemployment |
| Germans | 100.0 /100 | #8 | Exceptional 4.5% |
| Slovenes | 100.0 /100 | #9 | Exceptional 4.5% |
| Swiss | 100.0 /100 | #10 | Exceptional 4.6% |
| Scandinavians | 100.0 /100 | #11 | Exceptional 4.6% |
| Dutch | 100.0 /100 | #12 | Exceptional 4.6% |
| Belgians | 100.0 /100 | #13 | Exceptional 4.6% |
| Finns | 100.0 /100 | #14 | Exceptional 4.6% |
| English | 100.0 /100 | #15 | Exceptional 4.6% |
| Carpatho Rusyns | 99.9 /100 | #16 | Exceptional 4.7% |
| Croatians | 99.9 /100 | #17 | Exceptional 4.7% |
| Latvians | 99.9 /100 | #18 | Exceptional 4.7% |
| Poles | 99.9 /100 | #19 | Exceptional 4.7% |
| Bulgarians | 99.9 /100 | #20 | Exceptional 4.7% |
| Fijians | 99.9 /100 | #21 | Exceptional 4.7% |
| Europeans | 99.9 /100 | #22 | Exceptional 4.7% |