Paiute vs Lumbee Female Unemployment
COMPARE
Paiute
Lumbee
Female Unemployment
Female Unemployment Comparison
Paiute
Lumbee
6.8%
FEMALE UNEMPLOYMENT
0.0/ 100
METRIC RATING
331st/ 347
METRIC RANK
5.9%
FEMALE UNEMPLOYMENT
0.0/ 100
METRIC RATING
272nd/ 347
METRIC RANK
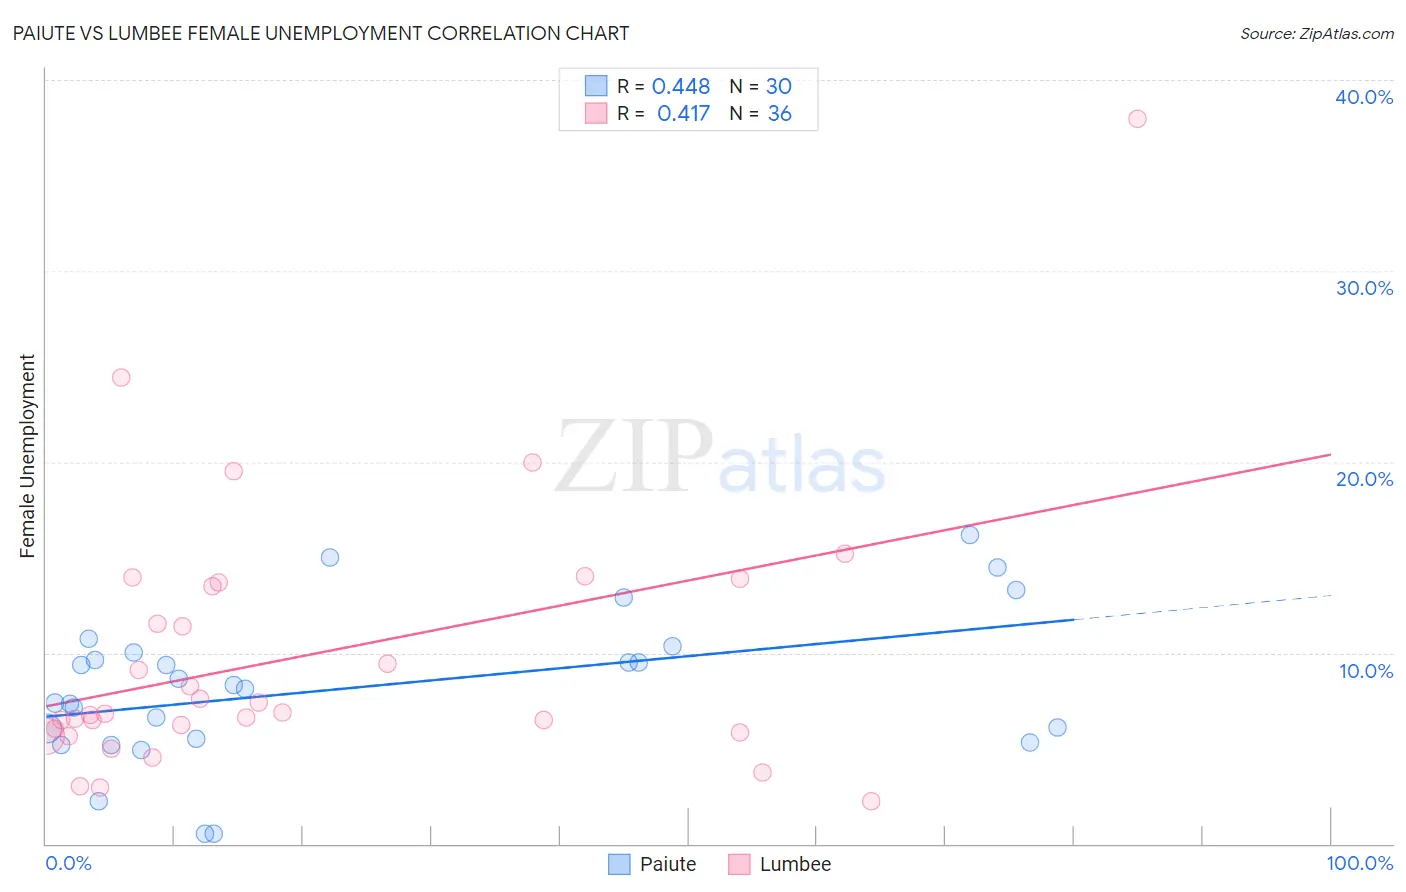
Paiute vs Lumbee Female Unemployment Correlation Chart
The statistical analysis conducted on geographies consisting of 58,292,378 people shows a moderate positive correlation between the proportion of Paiute and unemploymnet rate among females in the United States with a correlation coefficient (R) of 0.448 and weighted average of 6.8%. Similarly, the statistical analysis conducted on geographies consisting of 92,134,947 people shows a moderate positive correlation between the proportion of Lumbee and unemploymnet rate among females in the United States with a correlation coefficient (R) of 0.417 and weighted average of 5.9%, a difference of 14.4%.
Female Unemployment Correlation Summary
| Measurement | Paiute | Lumbee |
| Minimum | 0.50% | 2.2% |
| Maximum | 16.2% | 38.0% |
| Range | 15.7% | 35.8% |
| Mean | 8.2% | 9.8% |
| Median | 8.2% | 6.9% |
| Interquartile 25% (IQ1) | 5.5% | 5.9% |
| Interquartile 75% (IQ3) | 10.0% | 13.6% |
| Interquartile Range (IQR) | 4.5% | 7.7% |
| Standard Deviation (Sample) | 3.9% | 7.0% |
| Standard Deviation (Population) | 3.8% | 6.9% |
Similar Demographics by Female Unemployment
Demographics Similar to Paiute by Female Unemployment
In terms of female unemployment, the demographic groups most similar to Paiute are Yakama (6.7%, a difference of 1.1%), Immigrants from Guyana (6.7%, a difference of 1.7%), Guyanese (6.7%, a difference of 2.1%), Alaska Native (6.6%, a difference of 2.5%), and Native/Alaskan (6.6%, a difference of 2.6%).
| Demographics | Rating | Rank | Female Unemployment |
| Cheyenne | 0.0 /100 | #324 | Tragic 6.6% |
| Apache | 0.0 /100 | #325 | Tragic 6.6% |
| Natives/Alaskans | 0.0 /100 | #326 | Tragic 6.6% |
| Alaska Natives | 0.0 /100 | #327 | Tragic 6.6% |
| Guyanese | 0.0 /100 | #328 | Tragic 6.7% |
| Immigrants | Guyana | 0.0 /100 | #329 | Tragic 6.7% |
| Yakama | 0.0 /100 | #330 | Tragic 6.7% |
| Paiute | 0.0 /100 | #331 | Tragic 6.8% |
| Sioux | 0.0 /100 | #332 | Tragic 7.0% |
| Menominee | 0.0 /100 | #333 | Tragic 7.0% |
| Immigrants | Armenia | 0.0 /100 | #334 | Tragic 7.1% |
| Dominicans | 0.0 /100 | #335 | Tragic 7.2% |
| Immigrants | Dominican Republic | 0.0 /100 | #336 | Tragic 7.2% |
| Navajo | 0.0 /100 | #337 | Tragic 7.3% |
| Tohono O'odham | 0.0 /100 | #338 | Tragic 7.7% |
Demographics Similar to Lumbee by Female Unemployment
In terms of female unemployment, the demographic groups most similar to Lumbee are Ghanaian (5.9%, a difference of 0.010%), African (5.9%, a difference of 0.090%), Central American (5.9%, a difference of 0.19%), Immigrants from Honduras (5.9%, a difference of 0.29%), and Senegalese (6.0%, a difference of 0.58%).
| Demographics | Rating | Rank | Female Unemployment |
| Blackfeet | 0.0 /100 | #265 | Tragic 5.9% |
| Cape Verdeans | 0.0 /100 | #266 | Tragic 5.9% |
| Nepalese | 0.0 /100 | #267 | Tragic 5.9% |
| Hondurans | 0.0 /100 | #268 | Tragic 5.9% |
| Immigrants | Western Africa | 0.0 /100 | #269 | Tragic 5.9% |
| Immigrants | Honduras | 0.0 /100 | #270 | Tragic 5.9% |
| Central Americans | 0.0 /100 | #271 | Tragic 5.9% |
| Lumbee | 0.0 /100 | #272 | Tragic 5.9% |
| Ghanaians | 0.0 /100 | #273 | Tragic 5.9% |
| Africans | 0.0 /100 | #274 | Tragic 5.9% |
| Senegalese | 0.0 /100 | #275 | Tragic 6.0% |
| Bahamians | 0.0 /100 | #276 | Tragic 6.0% |
| Immigrants | Ghana | 0.0 /100 | #277 | Tragic 6.0% |
| Yaqui | 0.0 /100 | #278 | Tragic 6.0% |
| Armenians | 0.0 /100 | #279 | Tragic 6.0% |