Immigrants from Armenia vs Cambodian Female Unemployment
COMPARE
Immigrants from Armenia
Cambodian
Female Unemployment
Female Unemployment Comparison
Immigrants from Armenia
Cambodians
7.1%
FEMALE UNEMPLOYMENT
0.0/ 100
METRIC RATING
334th/ 347
METRIC RANK
4.9%
FEMALE UNEMPLOYMENT
99.1/ 100
METRIC RATING
51st/ 347
METRIC RANK
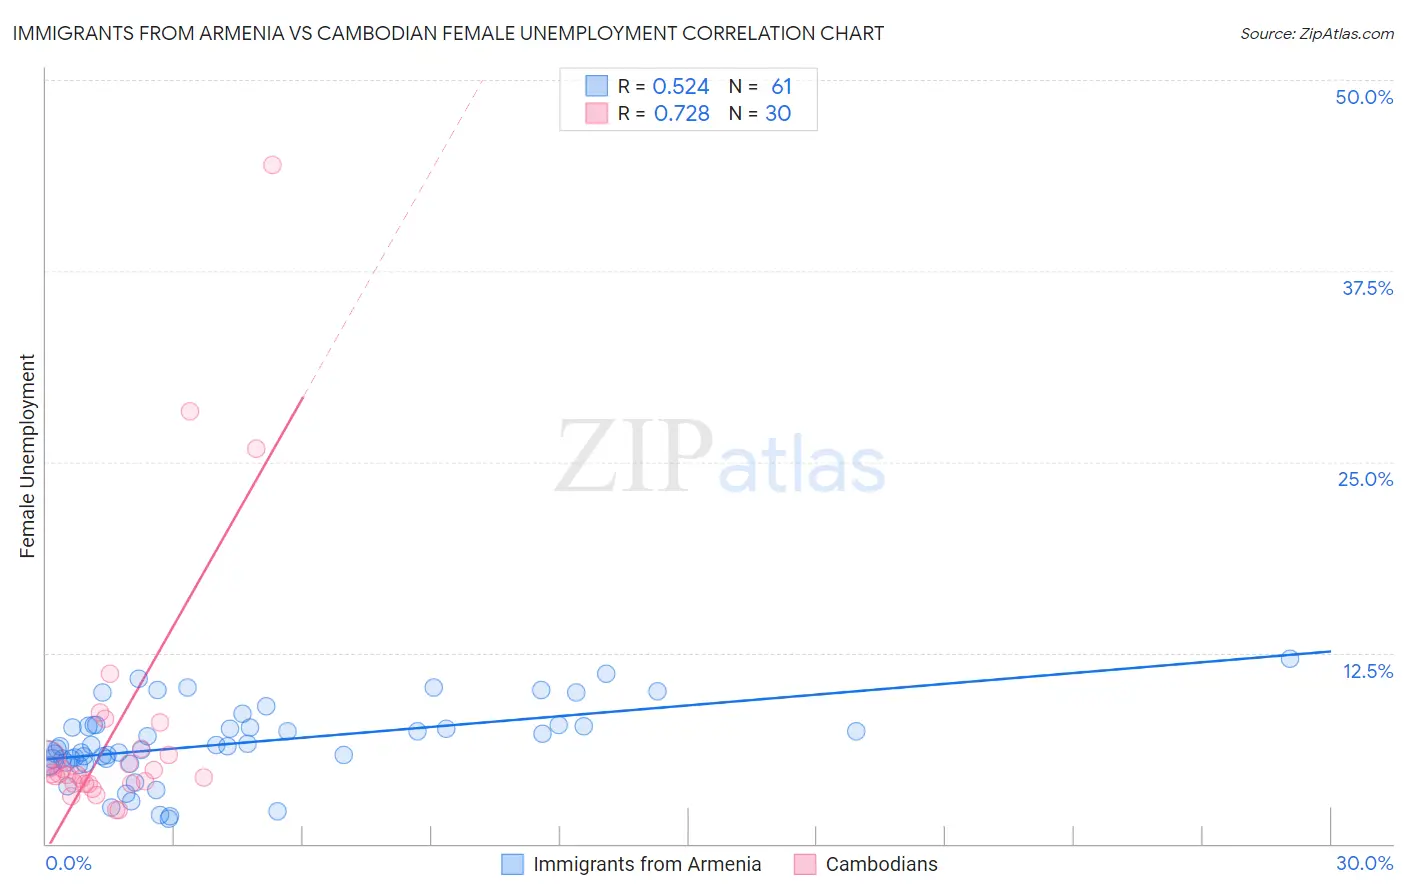
Immigrants from Armenia vs Cambodian Female Unemployment Correlation Chart
The statistical analysis conducted on geographies consisting of 97,677,717 people shows a substantial positive correlation between the proportion of Immigrants from Armenia and unemploymnet rate among females in the United States with a correlation coefficient (R) of 0.524 and weighted average of 7.1%. Similarly, the statistical analysis conducted on geographies consisting of 102,438,454 people shows a strong positive correlation between the proportion of Cambodians and unemploymnet rate among females in the United States with a correlation coefficient (R) of 0.728 and weighted average of 4.9%, a difference of 44.7%.
Female Unemployment Correlation Summary
| Measurement | Immigrants from Armenia | Cambodian |
| Minimum | 1.6% | 2.2% |
| Maximum | 12.1% | 44.4% |
| Range | 10.5% | 42.2% |
| Mean | 6.6% | 7.7% |
| Median | 6.4% | 4.5% |
| Interquartile 25% (IQ1) | 5.4% | 4.0% |
| Interquartile 75% (IQ3) | 7.7% | 6.2% |
| Interquartile Range (IQR) | 2.3% | 2.2% |
| Standard Deviation (Sample) | 2.4% | 9.1% |
| Standard Deviation (Population) | 2.4% | 9.0% |
Similar Demographics by Female Unemployment
Demographics Similar to Immigrants from Armenia by Female Unemployment
In terms of female unemployment, the demographic groups most similar to Immigrants from Armenia are Menominee (7.0%, a difference of 0.41%), Sioux (7.0%, a difference of 0.44%), Dominican (7.2%, a difference of 1.4%), Immigrants from Dominican Republic (7.2%, a difference of 2.1%), and Navajo (7.3%, a difference of 3.0%).
| Demographics | Rating | Rank | Female Unemployment |
| Alaska Natives | 0.0 /100 | #327 | Tragic 6.6% |
| Guyanese | 0.0 /100 | #328 | Tragic 6.7% |
| Immigrants | Guyana | 0.0 /100 | #329 | Tragic 6.7% |
| Yakama | 0.0 /100 | #330 | Tragic 6.7% |
| Paiute | 0.0 /100 | #331 | Tragic 6.8% |
| Sioux | 0.0 /100 | #332 | Tragic 7.0% |
| Menominee | 0.0 /100 | #333 | Tragic 7.0% |
| Immigrants | Armenia | 0.0 /100 | #334 | Tragic 7.1% |
| Dominicans | 0.0 /100 | #335 | Tragic 7.2% |
| Immigrants | Dominican Republic | 0.0 /100 | #336 | Tragic 7.2% |
| Navajo | 0.0 /100 | #337 | Tragic 7.3% |
| Tohono O'odham | 0.0 /100 | #338 | Tragic 7.7% |
| Immigrants | Yemen | 0.0 /100 | #339 | Tragic 7.8% |
| Hopi | 0.0 /100 | #340 | Tragic 8.1% |
| Inupiat | 0.0 /100 | #341 | Tragic 8.2% |
Demographics Similar to Cambodians by Female Unemployment
In terms of female unemployment, the demographic groups most similar to Cambodians are Immigrants from Cuba (4.9%, a difference of 0.020%), Slavic (4.9%, a difference of 0.020%), White/Caucasian (4.9%, a difference of 0.050%), Immigrants from Zimbabwe (4.9%, a difference of 0.11%), and Immigrants from Moldova (4.9%, a difference of 0.12%).
| Demographics | Rating | Rank | Female Unemployment |
| Greeks | 99.4 /100 | #44 | Exceptional 4.9% |
| Austrians | 99.3 /100 | #45 | Exceptional 4.9% |
| Immigrants | Bulgaria | 99.3 /100 | #46 | Exceptional 4.9% |
| Okinawans | 99.3 /100 | #47 | Exceptional 4.9% |
| Thais | 99.2 /100 | #48 | Exceptional 4.9% |
| Australians | 99.2 /100 | #49 | Exceptional 4.9% |
| Immigrants | Cuba | 99.1 /100 | #50 | Exceptional 4.9% |
| Cambodians | 99.1 /100 | #51 | Exceptional 4.9% |
| Slavs | 99.1 /100 | #52 | Exceptional 4.9% |
| Whites/Caucasians | 99.0 /100 | #53 | Exceptional 4.9% |
| Immigrants | Zimbabwe | 99.0 /100 | #54 | Exceptional 4.9% |
| Immigrants | Moldova | 99.0 /100 | #55 | Exceptional 4.9% |
| Serbians | 99.0 /100 | #56 | Exceptional 4.9% |
| Icelanders | 98.8 /100 | #57 | Exceptional 4.9% |
| Immigrants | Lithuania | 98.8 /100 | #58 | Exceptional 4.9% |