Immigrants from Armenia vs Cape Verdean Female Unemployment
COMPARE
Immigrants from Armenia
Cape Verdean
Female Unemployment
Female Unemployment Comparison
Immigrants from Armenia
Cape Verdeans
7.1%
FEMALE UNEMPLOYMENT
0.0/ 100
METRIC RATING
334th/ 347
METRIC RANK
5.9%
FEMALE UNEMPLOYMENT
0.0/ 100
METRIC RATING
266th/ 347
METRIC RANK
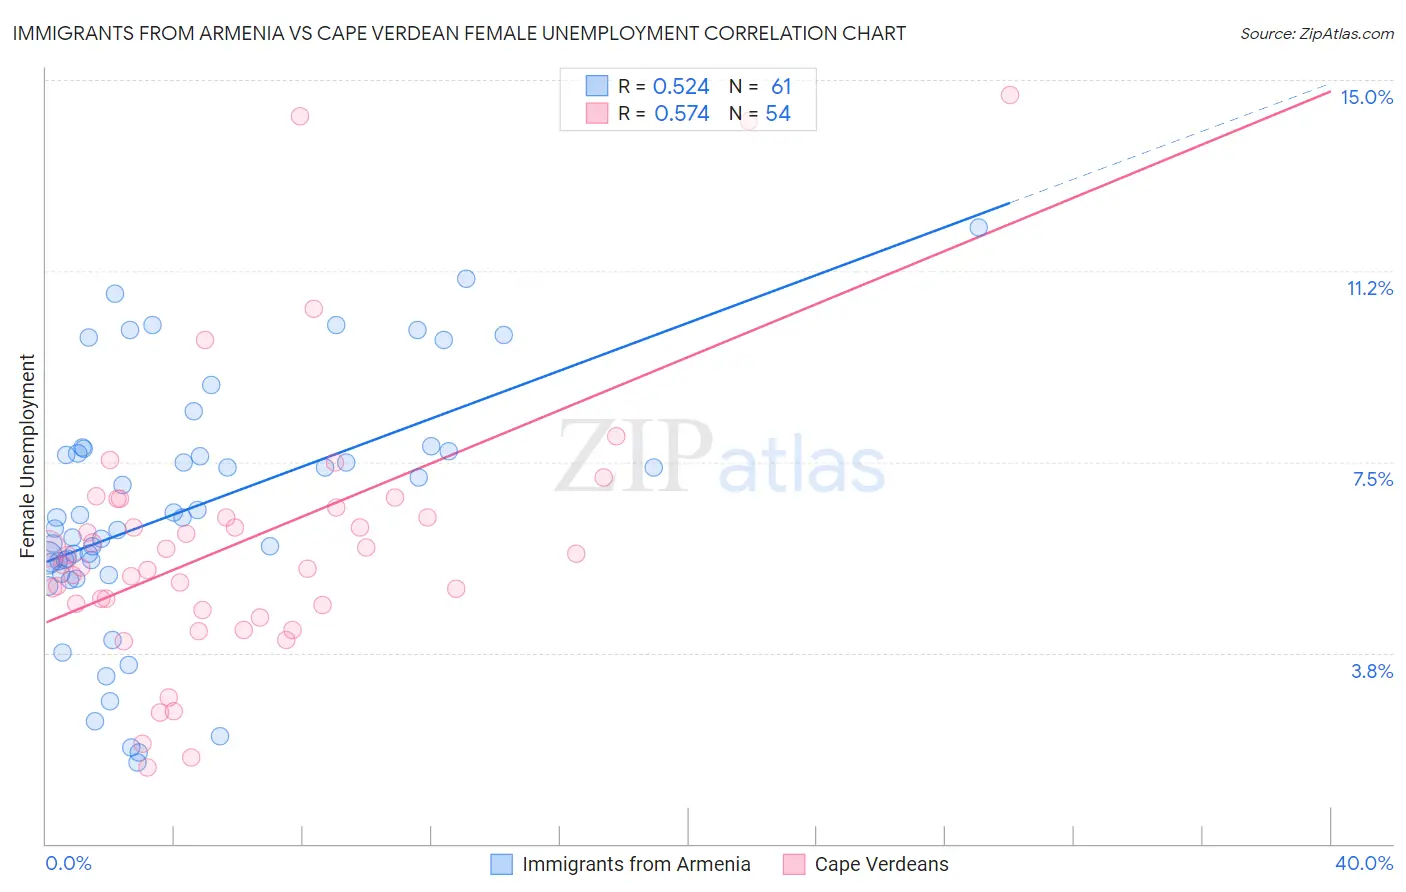
Immigrants from Armenia vs Cape Verdean Female Unemployment Correlation Chart
The statistical analysis conducted on geographies consisting of 97,677,717 people shows a substantial positive correlation between the proportion of Immigrants from Armenia and unemploymnet rate among females in the United States with a correlation coefficient (R) of 0.524 and weighted average of 7.1%. Similarly, the statistical analysis conducted on geographies consisting of 107,445,837 people shows a substantial positive correlation between the proportion of Cape Verdeans and unemploymnet rate among females in the United States with a correlation coefficient (R) of 0.574 and weighted average of 5.9%, a difference of 20.3%.
Female Unemployment Correlation Summary
| Measurement | Immigrants from Armenia | Cape Verdean |
| Minimum | 1.6% | 1.5% |
| Maximum | 12.1% | 14.7% |
| Range | 10.5% | 13.2% |
| Mean | 6.6% | 5.9% |
| Median | 6.4% | 5.6% |
| Interquartile 25% (IQ1) | 5.4% | 4.7% |
| Interquartile 75% (IQ3) | 7.7% | 6.6% |
| Interquartile Range (IQR) | 2.3% | 1.9% |
| Standard Deviation (Sample) | 2.4% | 2.7% |
| Standard Deviation (Population) | 2.4% | 2.7% |
Similar Demographics by Female Unemployment
Demographics Similar to Immigrants from Armenia by Female Unemployment
In terms of female unemployment, the demographic groups most similar to Immigrants from Armenia are Menominee (7.0%, a difference of 0.41%), Sioux (7.0%, a difference of 0.44%), Dominican (7.2%, a difference of 1.4%), Immigrants from Dominican Republic (7.2%, a difference of 2.1%), and Navajo (7.3%, a difference of 3.0%).
| Demographics | Rating | Rank | Female Unemployment |
| Alaska Natives | 0.0 /100 | #327 | Tragic 6.6% |
| Guyanese | 0.0 /100 | #328 | Tragic 6.7% |
| Immigrants | Guyana | 0.0 /100 | #329 | Tragic 6.7% |
| Yakama | 0.0 /100 | #330 | Tragic 6.7% |
| Paiute | 0.0 /100 | #331 | Tragic 6.8% |
| Sioux | 0.0 /100 | #332 | Tragic 7.0% |
| Menominee | 0.0 /100 | #333 | Tragic 7.0% |
| Immigrants | Armenia | 0.0 /100 | #334 | Tragic 7.1% |
| Dominicans | 0.0 /100 | #335 | Tragic 7.2% |
| Immigrants | Dominican Republic | 0.0 /100 | #336 | Tragic 7.2% |
| Navajo | 0.0 /100 | #337 | Tragic 7.3% |
| Tohono O'odham | 0.0 /100 | #338 | Tragic 7.7% |
| Immigrants | Yemen | 0.0 /100 | #339 | Tragic 7.8% |
| Hopi | 0.0 /100 | #340 | Tragic 8.1% |
| Inupiat | 0.0 /100 | #341 | Tragic 8.2% |
Demographics Similar to Cape Verdeans by Female Unemployment
In terms of female unemployment, the demographic groups most similar to Cape Verdeans are Nepalese (5.9%, a difference of 0.11%), Honduran (5.9%, a difference of 0.20%), Blackfeet (5.9%, a difference of 0.28%), Immigrants from Western Africa (5.9%, a difference of 0.40%), and Immigrants from Bahamas (5.8%, a difference of 0.68%).
| Demographics | Rating | Rank | Female Unemployment |
| Immigrants | Fiji | 0.2 /100 | #259 | Tragic 5.8% |
| Nigerians | 0.2 /100 | #260 | Tragic 5.8% |
| Kiowa | 0.1 /100 | #261 | Tragic 5.8% |
| Immigrants | Nigeria | 0.1 /100 | #262 | Tragic 5.8% |
| Immigrants | Azores | 0.1 /100 | #263 | Tragic 5.8% |
| Immigrants | Bahamas | 0.1 /100 | #264 | Tragic 5.8% |
| Blackfeet | 0.0 /100 | #265 | Tragic 5.9% |
| Cape Verdeans | 0.0 /100 | #266 | Tragic 5.9% |
| Nepalese | 0.0 /100 | #267 | Tragic 5.9% |
| Hondurans | 0.0 /100 | #268 | Tragic 5.9% |
| Immigrants | Western Africa | 0.0 /100 | #269 | Tragic 5.9% |
| Immigrants | Honduras | 0.0 /100 | #270 | Tragic 5.9% |
| Central Americans | 0.0 /100 | #271 | Tragic 5.9% |
| Lumbee | 0.0 /100 | #272 | Tragic 5.9% |
| Ghanaians | 0.0 /100 | #273 | Tragic 5.9% |