Dutch West Indian vs Pima Unemployment Among Women with Children Under 6 years
COMPARE
Dutch West Indian
Pima
Unemployment Among Women with Children Under 6 years
Unemployment Among Women with Children Under 6 years Comparison
Dutch West Indians
Pima
9.5%
UNEMPLOYMENT AMONG WOMEN WITH CHILDREN UNDER 6 YEARS
0.0/ 100
METRIC RATING
317th/ 347
METRIC RANK
13.4%
UNEMPLOYMENT AMONG WOMEN WITH CHILDREN UNDER 6 YEARS
0.0/ 100
METRIC RATING
338th/ 347
METRIC RANK
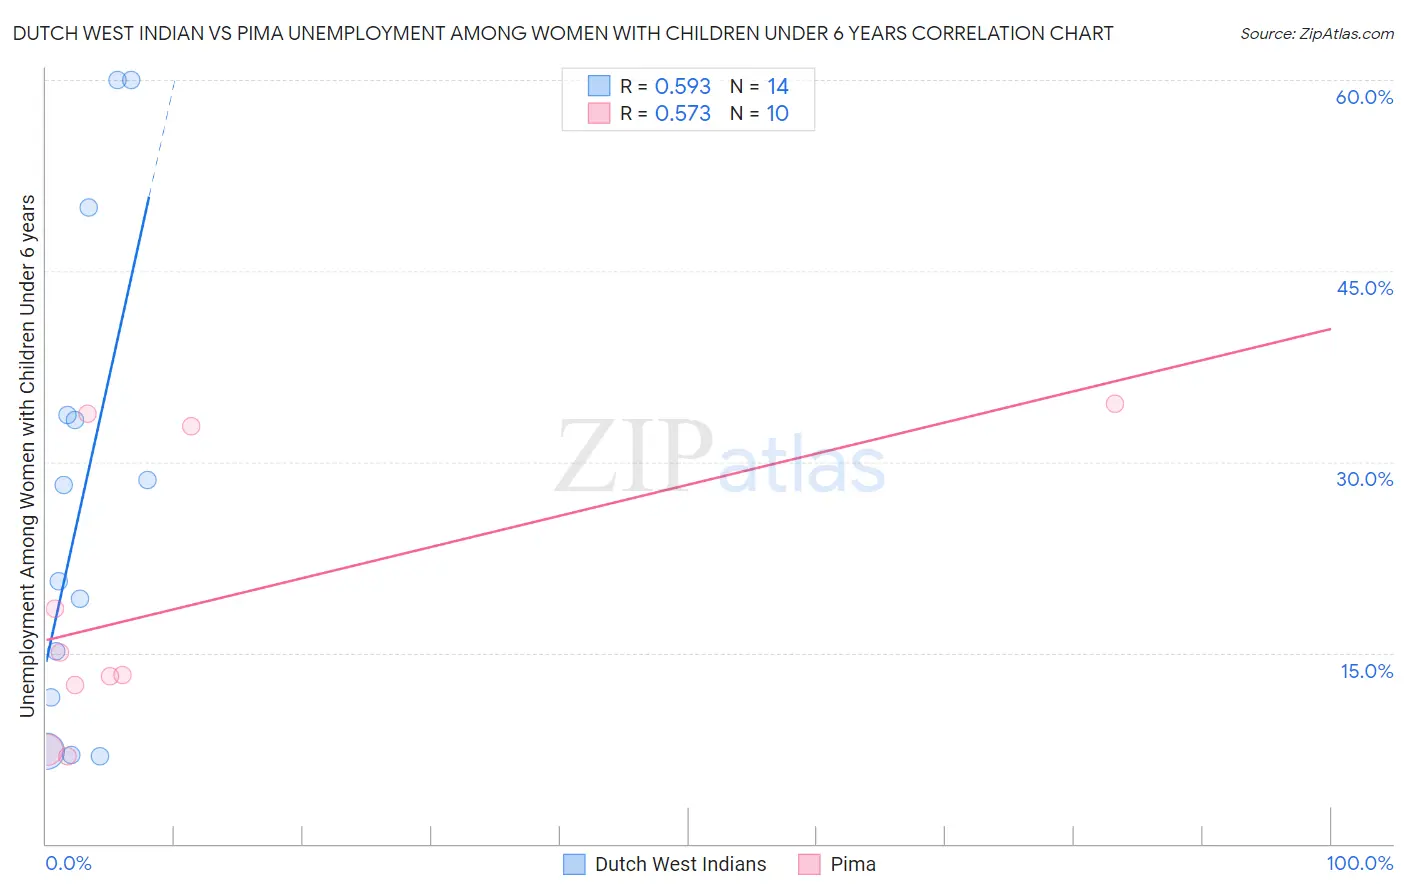
Dutch West Indian vs Pima Unemployment Among Women with Children Under 6 years Correlation Chart
The statistical analysis conducted on geographies consisting of 76,130,897 people shows a substantial positive correlation between the proportion of Dutch West Indians and unemployment rate among women with children under the age of 6 in the United States with a correlation coefficient (R) of 0.593 and weighted average of 9.5%. Similarly, the statistical analysis conducted on geographies consisting of 58,117,266 people shows a substantial positive correlation between the proportion of Pima and unemployment rate among women with children under the age of 6 in the United States with a correlation coefficient (R) of 0.573 and weighted average of 13.4%, a difference of 41.8%.
Unemployment Among Women with Children Under 6 years Correlation Summary
| Measurement | Dutch West Indian | Pima |
| Minimum | 6.9% | 6.9% |
| Maximum | 60.0% | 34.6% |
| Range | 53.1% | 27.7% |
| Mean | 27.2% | 18.8% |
| Median | 24.4% | 14.2% |
| Interquartile 25% (IQ1) | 11.5% | 12.4% |
| Interquartile 75% (IQ3) | 33.7% | 32.8% |
| Interquartile Range (IQR) | 22.2% | 20.4% |
| Standard Deviation (Sample) | 18.5% | 10.8% |
| Standard Deviation (Population) | 17.9% | 10.3% |
Similar Demographics by Unemployment Among Women with Children Under 6 years
Demographics Similar to Dutch West Indians by Unemployment Among Women with Children Under 6 years
In terms of unemployment among women with children under 6 years, the demographic groups most similar to Dutch West Indians are Osage (9.5%, a difference of 0.060%), Houma (9.4%, a difference of 0.79%), Marshallese (9.6%, a difference of 1.1%), Potawatomi (9.6%, a difference of 1.1%), and Central American Indian (9.6%, a difference of 1.2%).
| Demographics | Rating | Rank | Unemployment Among Women with Children Under 6 years |
| Cajuns | 0.0 /100 | #310 | Tragic 9.2% |
| French American Indians | 0.0 /100 | #311 | Tragic 9.2% |
| Immigrants | Azores | 0.0 /100 | #312 | Tragic 9.2% |
| Americans | 0.0 /100 | #313 | Tragic 9.3% |
| Fijians | 0.0 /100 | #314 | Tragic 9.3% |
| Cherokee | 0.0 /100 | #315 | Tragic 9.3% |
| Houma | 0.0 /100 | #316 | Tragic 9.4% |
| Dutch West Indians | 0.0 /100 | #317 | Tragic 9.5% |
| Osage | 0.0 /100 | #318 | Tragic 9.5% |
| Marshallese | 0.0 /100 | #319 | Tragic 9.6% |
| Potawatomi | 0.0 /100 | #320 | Tragic 9.6% |
| Central American Indians | 0.0 /100 | #321 | Tragic 9.6% |
| Alaska Natives | 0.0 /100 | #322 | Tragic 9.6% |
| Immigrants | Bahamas | 0.0 /100 | #323 | Tragic 9.6% |
| Paiute | 0.0 /100 | #324 | Tragic 9.7% |
Demographics Similar to Pima by Unemployment Among Women with Children Under 6 years
In terms of unemployment among women with children under 6 years, the demographic groups most similar to Pima are Navajo (13.5%, a difference of 0.40%), Immigrants from Yemen (13.5%, a difference of 0.40%), Chippewa (13.3%, a difference of 0.79%), Shoshone (13.2%, a difference of 1.9%), and Lumbee (13.8%, a difference of 2.6%).
| Demographics | Rating | Rank | Unemployment Among Women with Children Under 6 years |
| Colville | 0.0 /100 | #331 | Tragic 11.2% |
| Sioux | 0.0 /100 | #332 | Tragic 11.5% |
| Natives/Alaskans | 0.0 /100 | #333 | Tragic 11.5% |
| Apache | 0.0 /100 | #334 | Tragic 12.3% |
| Puerto Ricans | 0.0 /100 | #335 | Tragic 12.5% |
| Shoshone | 0.0 /100 | #336 | Tragic 13.2% |
| Chippewa | 0.0 /100 | #337 | Tragic 13.3% |
| Pima | 0.0 /100 | #338 | Tragic 13.4% |
| Navajo | 0.0 /100 | #339 | Tragic 13.5% |
| Immigrants | Yemen | 0.0 /100 | #340 | Tragic 13.5% |
| Lumbee | 0.0 /100 | #341 | Tragic 13.8% |
| Yuman | 0.0 /100 | #342 | Tragic 14.6% |
| Crow | 0.0 /100 | #343 | Tragic 14.6% |
| Hopi | 0.0 /100 | #344 | Tragic 16.8% |
| Inupiat | 0.0 /100 | #345 | Tragic 17.7% |