Immigrants from Albania vs Sri Lankan Female Unemployment
COMPARE
Immigrants from Albania
Sri Lankan
Female Unemployment
Female Unemployment Comparison
Immigrants from Albania
Sri Lankans
5.3%
FEMALE UNEMPLOYMENT
35.4/ 100
METRIC RATING
187th/ 347
METRIC RANK
5.2%
FEMALE UNEMPLOYMENT
59.4/ 100
METRIC RATING
168th/ 347
METRIC RANK
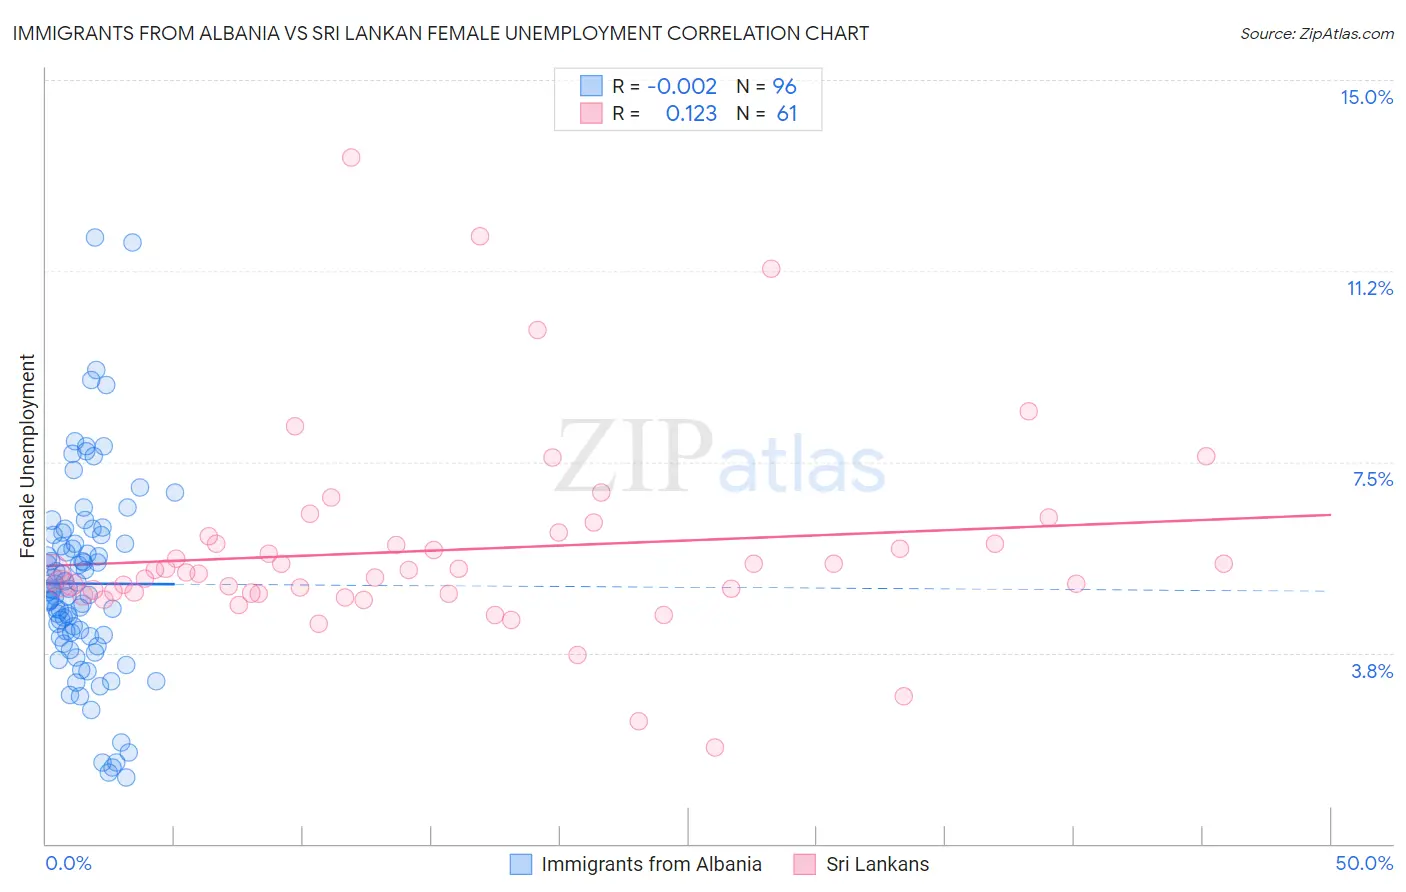
Immigrants from Albania vs Sri Lankan Female Unemployment Correlation Chart
The statistical analysis conducted on geographies consisting of 119,261,752 people shows no correlation between the proportion of Immigrants from Albania and unemploymnet rate among females in the United States with a correlation coefficient (R) of -0.002 and weighted average of 5.3%. Similarly, the statistical analysis conducted on geographies consisting of 438,500,315 people shows a poor positive correlation between the proportion of Sri Lankans and unemploymnet rate among females in the United States with a correlation coefficient (R) of 0.123 and weighted average of 5.2%, a difference of 1.5%.
Female Unemployment Correlation Summary
| Measurement | Immigrants from Albania | Sri Lankan |
| Minimum | 1.3% | 1.9% |
| Maximum | 11.9% | 13.5% |
| Range | 10.6% | 11.6% |
| Mean | 5.1% | 5.8% |
| Median | 5.0% | 5.3% |
| Interquartile 25% (IQ1) | 4.1% | 4.9% |
| Interquartile 75% (IQ3) | 6.0% | 6.0% |
| Interquartile Range (IQR) | 1.9% | 1.1% |
| Standard Deviation (Sample) | 1.9% | 2.0% |
| Standard Deviation (Population) | 1.9% | 1.9% |
Demographics Similar to Immigrants from Albania and Sri Lankans by Female Unemployment
In terms of female unemployment, the demographic groups most similar to Immigrants from Albania are Immigrants from Belarus (5.3%, a difference of 0.26%), Immigrants from Ukraine (5.3%, a difference of 0.30%), Malaysian (5.3%, a difference of 0.30%), Immigrants from Indonesia (5.3%, a difference of 0.34%), and Nonimmigrants (5.3%, a difference of 0.45%). Similarly, the demographic groups most similar to Sri Lankans are Immigrants from Chile (5.2%, a difference of 0.030%), Immigrants from Thailand (5.2%, a difference of 0.17%), Spanish (5.2%, a difference of 0.22%), Immigrants from Denmark (5.2%, a difference of 0.27%), and Immigrants from Uganda (5.3%, a difference of 0.53%).
| Demographics | Rating | Rank | Female Unemployment |
| Immigrants | Thailand | 62.1 /100 | #167 | Good 5.2% |
| Sri Lankans | 59.4 /100 | #168 | Average 5.2% |
| Immigrants | Chile | 59.0 /100 | #169 | Average 5.2% |
| Spanish | 55.9 /100 | #170 | Average 5.2% |
| Immigrants | Denmark | 55.0 /100 | #171 | Average 5.2% |
| Immigrants | Uganda | 50.7 /100 | #172 | Average 5.3% |
| Iranians | 50.4 /100 | #173 | Average 5.3% |
| Immigrants | Poland | 50.0 /100 | #174 | Average 5.3% |
| Immigrants | Laos | 47.5 /100 | #175 | Average 5.3% |
| Immigrants | Vietnam | 47.5 /100 | #176 | Average 5.3% |
| Immigrants | Morocco | 47.4 /100 | #177 | Average 5.3% |
| Immigrants | Southern Europe | 46.2 /100 | #178 | Average 5.3% |
| Laotians | 45.1 /100 | #179 | Average 5.3% |
| Immigrants | Congo | 43.1 /100 | #180 | Average 5.3% |
| Taiwanese | 42.7 /100 | #181 | Average 5.3% |
| Immigrants | Nonimmigrants | 42.6 /100 | #182 | Average 5.3% |
| Immigrants | Indonesia | 40.7 /100 | #183 | Average 5.3% |
| Immigrants | Ukraine | 40.1 /100 | #184 | Average 5.3% |
| Malaysians | 40.1 /100 | #185 | Average 5.3% |
| Immigrants | Belarus | 39.4 /100 | #186 | Fair 5.3% |
| Immigrants | Albania | 35.4 /100 | #187 | Fair 5.3% |