Nepalese vs Sri Lankan Female Unemployment
COMPARE
Nepalese
Sri Lankan
Female Unemployment
Female Unemployment Comparison
Nepalese
Sri Lankans
5.9%
FEMALE UNEMPLOYMENT
0.0/ 100
METRIC RATING
267th/ 347
METRIC RANK
5.2%
FEMALE UNEMPLOYMENT
59.4/ 100
METRIC RATING
168th/ 347
METRIC RANK
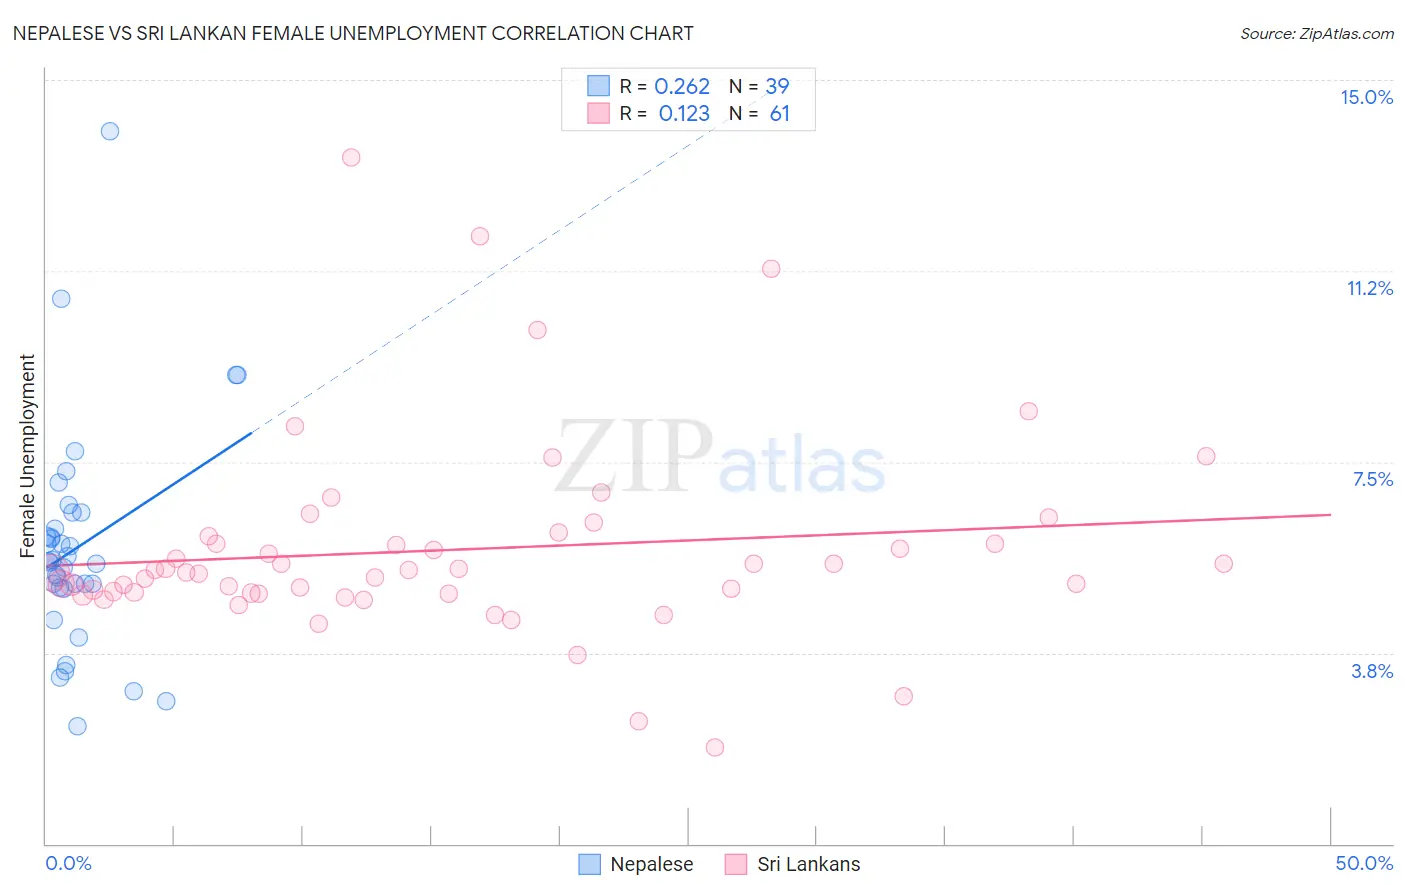
Nepalese vs Sri Lankan Female Unemployment Correlation Chart
The statistical analysis conducted on geographies consisting of 24,519,269 people shows a weak positive correlation between the proportion of Nepalese and unemploymnet rate among females in the United States with a correlation coefficient (R) of 0.262 and weighted average of 5.9%. Similarly, the statistical analysis conducted on geographies consisting of 438,500,315 people shows a poor positive correlation between the proportion of Sri Lankans and unemploymnet rate among females in the United States with a correlation coefficient (R) of 0.123 and weighted average of 5.2%, a difference of 12.6%.
Female Unemployment Correlation Summary
| Measurement | Nepalese | Sri Lankan |
| Minimum | 2.3% | 1.9% |
| Maximum | 14.0% | 13.5% |
| Range | 11.7% | 11.6% |
| Mean | 5.8% | 5.8% |
| Median | 5.5% | 5.3% |
| Interquartile 25% (IQ1) | 5.0% | 4.9% |
| Interquartile 75% (IQ3) | 6.5% | 6.0% |
| Interquartile Range (IQR) | 1.5% | 1.1% |
| Standard Deviation (Sample) | 2.2% | 2.0% |
| Standard Deviation (Population) | 2.1% | 1.9% |
Similar Demographics by Female Unemployment
Demographics Similar to Nepalese by Female Unemployment
In terms of female unemployment, the demographic groups most similar to Nepalese are Honduran (5.9%, a difference of 0.10%), Cape Verdean (5.9%, a difference of 0.11%), Immigrants from Western Africa (5.9%, a difference of 0.30%), Blackfeet (5.9%, a difference of 0.39%), and Immigrants from Honduras (5.9%, a difference of 0.71%).
| Demographics | Rating | Rank | Female Unemployment |
| Nigerians | 0.2 /100 | #260 | Tragic 5.8% |
| Kiowa | 0.1 /100 | #261 | Tragic 5.8% |
| Immigrants | Nigeria | 0.1 /100 | #262 | Tragic 5.8% |
| Immigrants | Azores | 0.1 /100 | #263 | Tragic 5.8% |
| Immigrants | Bahamas | 0.1 /100 | #264 | Tragic 5.8% |
| Blackfeet | 0.0 /100 | #265 | Tragic 5.9% |
| Cape Verdeans | 0.0 /100 | #266 | Tragic 5.9% |
| Nepalese | 0.0 /100 | #267 | Tragic 5.9% |
| Hondurans | 0.0 /100 | #268 | Tragic 5.9% |
| Immigrants | Western Africa | 0.0 /100 | #269 | Tragic 5.9% |
| Immigrants | Honduras | 0.0 /100 | #270 | Tragic 5.9% |
| Central Americans | 0.0 /100 | #271 | Tragic 5.9% |
| Lumbee | 0.0 /100 | #272 | Tragic 5.9% |
| Ghanaians | 0.0 /100 | #273 | Tragic 5.9% |
| Africans | 0.0 /100 | #274 | Tragic 5.9% |
Demographics Similar to Sri Lankans by Female Unemployment
In terms of female unemployment, the demographic groups most similar to Sri Lankans are Immigrants from Chile (5.2%, a difference of 0.030%), Immigrants from Thailand (5.2%, a difference of 0.17%), Syrian (5.2%, a difference of 0.21%), Native Hawaiian (5.2%, a difference of 0.21%), and Spanish (5.2%, a difference of 0.22%).
| Demographics | Rating | Rank | Female Unemployment |
| Immigrants | Pakistan | 66.7 /100 | #161 | Good 5.2% |
| Potawatomi | 65.9 /100 | #162 | Good 5.2% |
| Immigrants | Asia | 64.3 /100 | #163 | Good 5.2% |
| Bangladeshis | 64.3 /100 | #164 | Good 5.2% |
| Syrians | 62.8 /100 | #165 | Good 5.2% |
| Native Hawaiians | 62.7 /100 | #166 | Good 5.2% |
| Immigrants | Thailand | 62.1 /100 | #167 | Good 5.2% |
| Sri Lankans | 59.4 /100 | #168 | Average 5.2% |
| Immigrants | Chile | 59.0 /100 | #169 | Average 5.2% |
| Spanish | 55.9 /100 | #170 | Average 5.2% |
| Immigrants | Denmark | 55.0 /100 | #171 | Average 5.2% |
| Immigrants | Uganda | 50.7 /100 | #172 | Average 5.3% |
| Iranians | 50.4 /100 | #173 | Average 5.3% |
| Immigrants | Poland | 50.0 /100 | #174 | Average 5.3% |
| Immigrants | Laos | 47.5 /100 | #175 | Average 5.3% |