Immigrants from Albania vs Hispanic or Latino Female Unemployment
COMPARE
Immigrants from Albania
Hispanic or Latino
Female Unemployment
Female Unemployment Comparison
Immigrants from Albania
Hispanics or Latinos
5.3%
FEMALE UNEMPLOYMENT
35.4/ 100
METRIC RATING
187th/ 347
METRIC RANK
6.2%
FEMALE UNEMPLOYMENT
0.0/ 100
METRIC RATING
308th/ 347
METRIC RANK
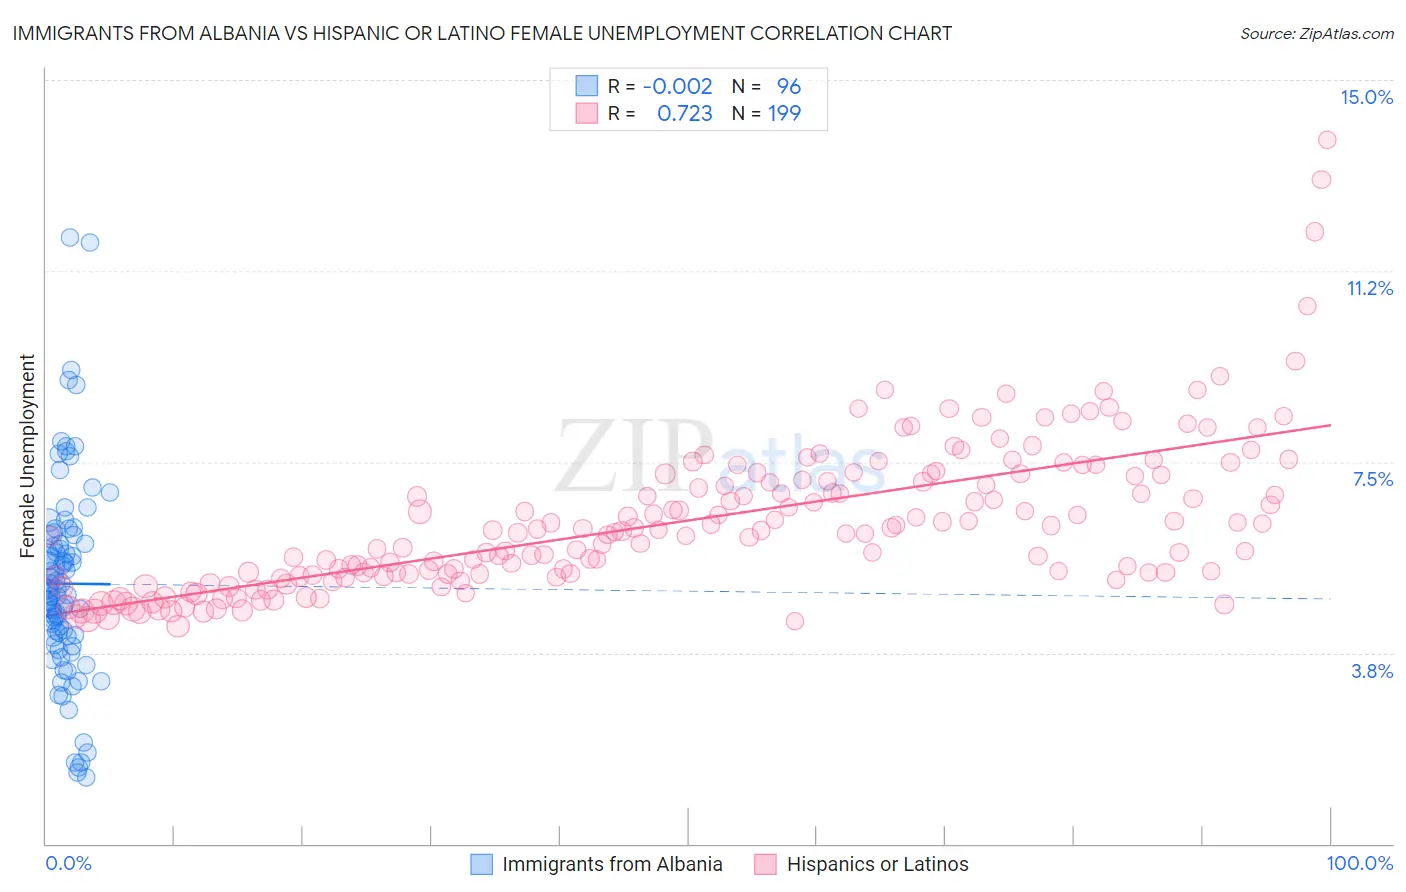
Immigrants from Albania vs Hispanic or Latino Female Unemployment Correlation Chart
The statistical analysis conducted on geographies consisting of 119,261,752 people shows no correlation between the proportion of Immigrants from Albania and unemploymnet rate among females in the United States with a correlation coefficient (R) of -0.002 and weighted average of 5.3%. Similarly, the statistical analysis conducted on geographies consisting of 562,804,515 people shows a strong positive correlation between the proportion of Hispanics or Latinos and unemploymnet rate among females in the United States with a correlation coefficient (R) of 0.723 and weighted average of 6.2%, a difference of 17.5%.
Female Unemployment Correlation Summary
| Measurement | Immigrants from Albania | Hispanic or Latino |
| Minimum | 1.3% | 4.3% |
| Maximum | 11.9% | 13.8% |
| Range | 10.6% | 9.5% |
| Mean | 5.1% | 6.3% |
| Median | 5.0% | 6.1% |
| Interquartile 25% (IQ1) | 4.1% | 5.3% |
| Interquartile 75% (IQ3) | 6.0% | 7.2% |
| Interquartile Range (IQR) | 1.9% | 1.9% |
| Standard Deviation (Sample) | 1.9% | 1.5% |
| Standard Deviation (Population) | 1.9% | 1.5% |
Similar Demographics by Female Unemployment
Demographics Similar to Immigrants from Albania by Female Unemployment
In terms of female unemployment, the demographic groups most similar to Immigrants from Albania are Afghan (5.3%, a difference of 0.10%), Costa Rican (5.3%, a difference of 0.10%), Immigrants from Belarus (5.3%, a difference of 0.26%), Ugandan (5.3%, a difference of 0.28%), and Immigrants from Ukraine (5.3%, a difference of 0.30%).
| Demographics | Rating | Rank | Female Unemployment |
| Immigrants | Congo | 43.1 /100 | #180 | Average 5.3% |
| Taiwanese | 42.7 /100 | #181 | Average 5.3% |
| Immigrants | Nonimmigrants | 42.6 /100 | #182 | Average 5.3% |
| Immigrants | Indonesia | 40.7 /100 | #183 | Average 5.3% |
| Immigrants | Ukraine | 40.1 /100 | #184 | Average 5.3% |
| Malaysians | 40.1 /100 | #185 | Average 5.3% |
| Immigrants | Belarus | 39.4 /100 | #186 | Fair 5.3% |
| Immigrants | Albania | 35.4 /100 | #187 | Fair 5.3% |
| Afghans | 33.9 /100 | #188 | Fair 5.3% |
| Costa Ricans | 33.8 /100 | #189 | Fair 5.3% |
| Ugandans | 31.2 /100 | #190 | Fair 5.3% |
| Cherokee | 30.8 /100 | #191 | Fair 5.3% |
| Portuguese | 28.6 /100 | #192 | Fair 5.3% |
| Arabs | 27.7 /100 | #193 | Fair 5.3% |
| Colombians | 27.0 /100 | #194 | Fair 5.3% |
Demographics Similar to Hispanics or Latinos by Female Unemployment
In terms of female unemployment, the demographic groups most similar to Hispanics or Latinos are Shoshone (6.2%, a difference of 0.060%), Immigrants from Central America (6.2%, a difference of 0.070%), Spanish American Indian (6.2%, a difference of 0.23%), Immigrants from Jamaica (6.2%, a difference of 0.29%), and Ecuadorian (6.3%, a difference of 0.58%).
| Demographics | Rating | Rank | Female Unemployment |
| Immigrants | Barbados | 0.0 /100 | #301 | Tragic 6.2% |
| U.S. Virgin Islanders | 0.0 /100 | #302 | Tragic 6.2% |
| Barbadians | 0.0 /100 | #303 | Tragic 6.2% |
| Immigrants | Jamaica | 0.0 /100 | #304 | Tragic 6.2% |
| Spanish American Indians | 0.0 /100 | #305 | Tragic 6.2% |
| Immigrants | Central America | 0.0 /100 | #306 | Tragic 6.2% |
| Shoshone | 0.0 /100 | #307 | Tragic 6.2% |
| Hispanics or Latinos | 0.0 /100 | #308 | Tragic 6.2% |
| Ecuadorians | 0.0 /100 | #309 | Tragic 6.3% |
| Central American Indians | 0.0 /100 | #310 | Tragic 6.3% |
| Immigrants | Mexico | 0.0 /100 | #311 | Tragic 6.3% |
| Immigrants | Grenada | 0.0 /100 | #312 | Tragic 6.3% |
| Belizeans | 0.0 /100 | #313 | Tragic 6.3% |
| Immigrants | Ecuador | 0.0 /100 | #314 | Tragic 6.4% |
| Pueblo | 0.0 /100 | #315 | Tragic 6.4% |