Immigrants from Albania vs Sri Lankan Unemployment Among Ages 25 to 29 years
COMPARE
Immigrants from Albania
Sri Lankan
Unemployment Among Ages 25 to 29 years
Unemployment Among Ages 25 to 29 years Comparison
Immigrants from Albania
Sri Lankans
6.4%
UNEMPLOYMENT AMONG AGES 25 TO 29 YEARS
87.9/ 100
METRIC RATING
109th/ 347
METRIC RANK
6.5%
UNEMPLOYMENT AMONG AGES 25 TO 29 YEARS
80.3/ 100
METRIC RATING
129th/ 347
METRIC RANK
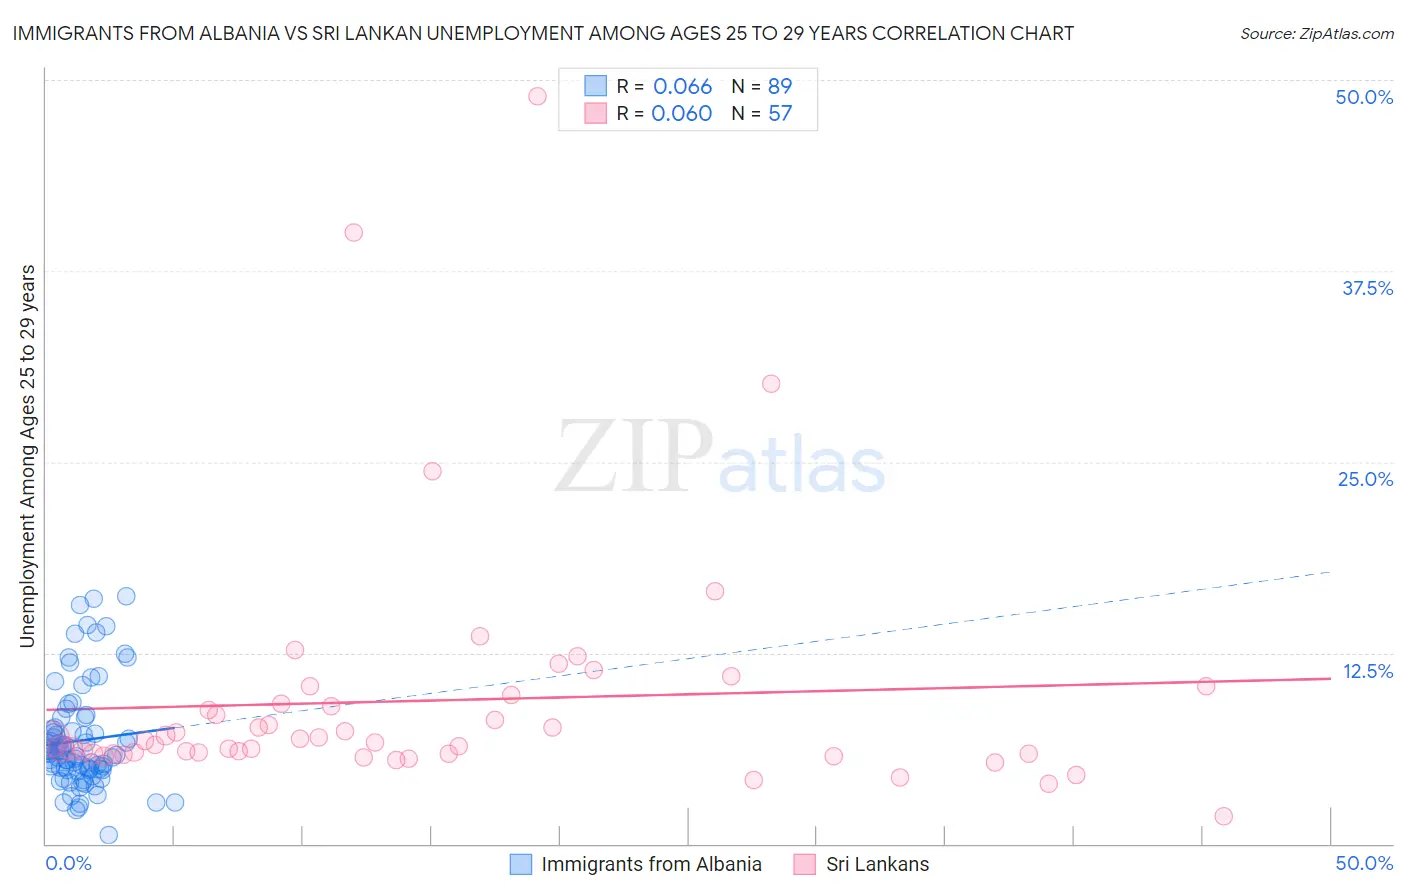
Immigrants from Albania vs Sri Lankan Unemployment Among Ages 25 to 29 years Correlation Chart
The statistical analysis conducted on geographies consisting of 117,024,271 people shows a slight positive correlation between the proportion of Immigrants from Albania and unemployment rate among population between the ages 25 and 29 in the United States with a correlation coefficient (R) of 0.066 and weighted average of 6.4%. Similarly, the statistical analysis conducted on geographies consisting of 417,939,567 people shows a slight positive correlation between the proportion of Sri Lankans and unemployment rate among population between the ages 25 and 29 in the United States with a correlation coefficient (R) of 0.060 and weighted average of 6.5%, a difference of 0.92%.
Unemployment Among Ages 25 to 29 years Correlation Summary
| Measurement | Immigrants from Albania | Sri Lankan |
| Minimum | 0.60% | 1.8% |
| Maximum | 16.2% | 48.9% |
| Range | 15.6% | 47.1% |
| Mean | 6.8% | 9.4% |
| Median | 5.9% | 6.8% |
| Interquartile 25% (IQ1) | 4.8% | 5.9% |
| Interquartile 75% (IQ3) | 7.5% | 9.5% |
| Interquartile Range (IQR) | 2.7% | 3.6% |
| Standard Deviation (Sample) | 3.3% | 8.2% |
| Standard Deviation (Population) | 3.3% | 8.1% |
Demographics Similar to Immigrants from Albania and Sri Lankans by Unemployment Among Ages 25 to 29 years
In terms of unemployment among ages 25 to 29 years, the demographic groups most similar to Immigrants from Albania are European (6.4%, a difference of 0.010%), Immigrants from Colombia (6.4%, a difference of 0.050%), Immigrants from Nicaragua (6.4%, a difference of 0.070%), Immigrants from Egypt (6.5%, a difference of 0.12%), and German (6.5%, a difference of 0.23%). Similarly, the demographic groups most similar to Sri Lankans are Immigrants from Chile (6.5%, a difference of 0.020%), Dutch (6.5%, a difference of 0.040%), Brazilian (6.5%, a difference of 0.17%), Syrian (6.5%, a difference of 0.19%), and Arab (6.5%, a difference of 0.23%).
| Demographics | Rating | Rank | Unemployment Among Ages 25 to 29 years |
| Immigrants | Albania | 87.9 /100 | #109 | Excellent 6.4% |
| Europeans | 87.8 /100 | #110 | Excellent 6.4% |
| Immigrants | Colombia | 87.6 /100 | #111 | Excellent 6.4% |
| Immigrants | Nicaragua | 87.5 /100 | #112 | Excellent 6.4% |
| Immigrants | Egypt | 87.1 /100 | #113 | Excellent 6.5% |
| Germans | 86.3 /100 | #114 | Excellent 6.5% |
| Macedonians | 86.1 /100 | #115 | Excellent 6.5% |
| Pakistanis | 85.9 /100 | #116 | Excellent 6.5% |
| Immigrants | Uruguay | 85.7 /100 | #117 | Excellent 6.5% |
| Chileans | 85.3 /100 | #118 | Excellent 6.5% |
| Immigrants | South Africa | 84.9 /100 | #119 | Excellent 6.5% |
| Immigrants | Moldova | 84.5 /100 | #120 | Excellent 6.5% |
| Immigrants | Uganda | 84.5 /100 | #121 | Excellent 6.5% |
| Immigrants | Belarus | 83.7 /100 | #122 | Excellent 6.5% |
| Laotians | 83.6 /100 | #123 | Excellent 6.5% |
| Arabs | 82.5 /100 | #124 | Excellent 6.5% |
| Syrians | 82.1 /100 | #125 | Excellent 6.5% |
| Brazilians | 81.9 /100 | #126 | Excellent 6.5% |
| Dutch | 80.6 /100 | #127 | Excellent 6.5% |
| Immigrants | Chile | 80.5 /100 | #128 | Excellent 6.5% |
| Sri Lankans | 80.3 /100 | #129 | Excellent 6.5% |