Immigrants from Albania vs English Unemployment Among Seniors over 75 years
COMPARE
Immigrants from Albania
English
Unemployment Among Seniors over 75 years
Unemployment Among Seniors over 75 years Comparison
Immigrants from Albania
English
7.9%
UNEMPLOYMENT AMONG SENIORS OVER 75 YEARS
99.9/ 100
METRIC RATING
62nd/ 347
METRIC RANK
10.1%
UNEMPLOYMENT AMONG SENIORS OVER 75 YEARS
0.0/ 100
METRIC RATING
309th/ 347
METRIC RANK
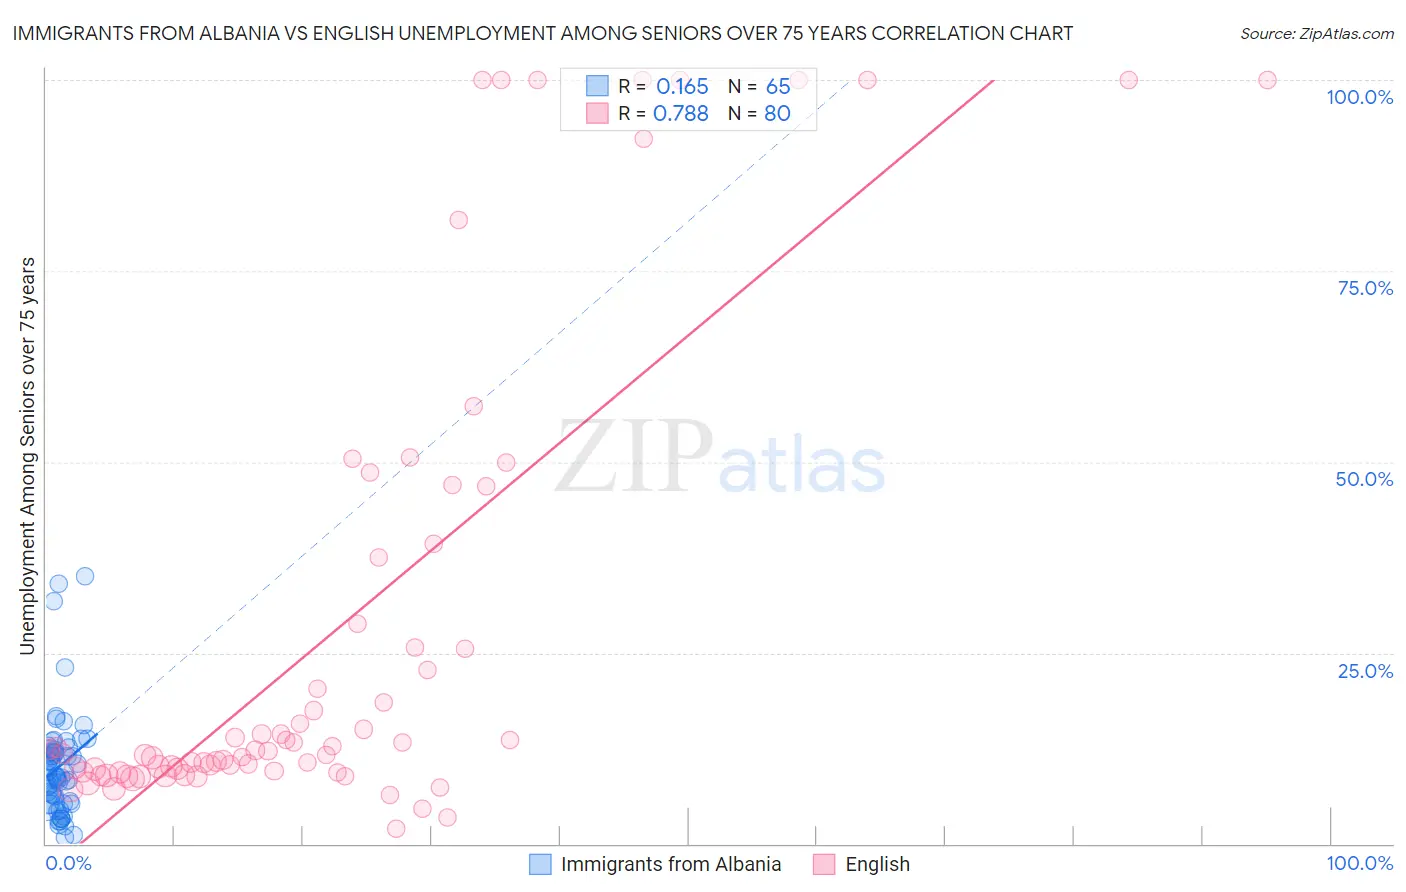
Immigrants from Albania vs English Unemployment Among Seniors over 75 years Correlation Chart
The statistical analysis conducted on geographies consisting of 83,788,763 people shows a poor positive correlation between the proportion of Immigrants from Albania and unemployment rate among seniors over the age of 75 in the United States with a correlation coefficient (R) of 0.165 and weighted average of 7.9%. Similarly, the statistical analysis conducted on geographies consisting of 234,892,703 people shows a strong positive correlation between the proportion of English and unemployment rate among seniors over the age of 75 in the United States with a correlation coefficient (R) of 0.788 and weighted average of 10.1%, a difference of 27.1%.
Unemployment Among Seniors over 75 years Correlation Summary
| Measurement | Immigrants from Albania | English |
| Minimum | 0.80% | 1.9% |
| Maximum | 35.0% | 100.0% |
| Range | 34.2% | 98.1% |
| Mean | 10.1% | 27.6% |
| Median | 9.0% | 12.2% |
| Interquartile 25% (IQ1) | 5.4% | 9.5% |
| Interquartile 75% (IQ3) | 12.3% | 33.1% |
| Interquartile Range (IQR) | 6.9% | 23.6% |
| Standard Deviation (Sample) | 6.8% | 30.8% |
| Standard Deviation (Population) | 6.7% | 30.6% |
Similar Demographics by Unemployment Among Seniors over 75 years
Demographics Similar to Immigrants from Albania by Unemployment Among Seniors over 75 years
In terms of unemployment among seniors over 75 years, the demographic groups most similar to Immigrants from Albania are Uruguayan (7.9%, a difference of 0.030%), Immigrants from Morocco (7.9%, a difference of 0.060%), Immigrants from Nicaragua (7.9%, a difference of 0.070%), Indonesian (7.9%, a difference of 0.11%), and Immigrants from Taiwan (7.9%, a difference of 0.13%).
| Demographics | Rating | Rank | Unemployment Among Seniors over 75 years |
| Filipinos | 99.9 /100 | #55 | Exceptional 7.9% |
| Immigrants | Eastern Asia | 99.9 /100 | #56 | Exceptional 7.9% |
| Ottawa | 99.9 /100 | #57 | Exceptional 7.9% |
| Iranians | 99.9 /100 | #58 | Exceptional 7.9% |
| Indonesians | 99.9 /100 | #59 | Exceptional 7.9% |
| Immigrants | Morocco | 99.9 /100 | #60 | Exceptional 7.9% |
| Uruguayans | 99.9 /100 | #61 | Exceptional 7.9% |
| Immigrants | Albania | 99.9 /100 | #62 | Exceptional 7.9% |
| Immigrants | Nicaragua | 99.9 /100 | #63 | Exceptional 7.9% |
| Immigrants | Taiwan | 99.9 /100 | #64 | Exceptional 7.9% |
| Argentineans | 99.9 /100 | #65 | Exceptional 7.9% |
| Immigrants | Austria | 99.9 /100 | #66 | Exceptional 8.0% |
| Immigrants | Syria | 99.9 /100 | #67 | Exceptional 8.0% |
| Immigrants | South Africa | 99.9 /100 | #68 | Exceptional 8.0% |
| Indians (Asian) | 99.9 /100 | #69 | Exceptional 8.0% |
Demographics Similar to English by Unemployment Among Seniors over 75 years
In terms of unemployment among seniors over 75 years, the demographic groups most similar to English are White/Caucasian (10.1%, a difference of 0.070%), Hungarian (10.1%, a difference of 0.19%), Scottish (10.1%, a difference of 0.30%), Chippewa (10.1%, a difference of 0.31%), and Nepalese (10.1%, a difference of 0.43%).
| Demographics | Rating | Rank | Unemployment Among Seniors over 75 years |
| Finns | 0.0 /100 | #302 | Tragic 10.0% |
| Puget Sound Salish | 0.0 /100 | #303 | Tragic 10.0% |
| Scotch-Irish | 0.0 /100 | #304 | Tragic 10.0% |
| Swedes | 0.0 /100 | #305 | Tragic 10.0% |
| Italians | 0.0 /100 | #306 | Tragic 10.0% |
| Immigrants | Fiji | 0.0 /100 | #307 | Tragic 10.0% |
| Whites/Caucasians | 0.0 /100 | #308 | Tragic 10.1% |
| English | 0.0 /100 | #309 | Tragic 10.1% |
| Hungarians | 0.0 /100 | #310 | Tragic 10.1% |
| Scottish | 0.0 /100 | #311 | Tragic 10.1% |
| Chippewa | 0.0 /100 | #312 | Tragic 10.1% |
| Nepalese | 0.0 /100 | #313 | Tragic 10.1% |
| Dutch West Indians | 0.0 /100 | #314 | Tragic 10.2% |
| Pennsylvania Germans | 0.0 /100 | #315 | Tragic 10.2% |
| Natives/Alaskans | 0.0 /100 | #316 | Tragic 10.2% |