Immigrants from Africa vs Hmong Unemployment Among Women with Children Ages 6 to 17 years
COMPARE
Immigrants from Africa
Hmong
Unemployment Among Women with Children Ages 6 to 17 years
Unemployment Among Women with Children Ages 6 to 17 years Comparison
Immigrants from Africa
Hmong
9.4%
UNEMPLOYMENT AMONG WOMEN WITH CHILDREN AGES 6 TO 17 YEARS
1.6/ 100
METRIC RATING
246th/ 347
METRIC RANK
8.7%
UNEMPLOYMENT AMONG WOMEN WITH CHILDREN AGES 6 TO 17 YEARS
94.3/ 100
METRIC RATING
128th/ 347
METRIC RANK
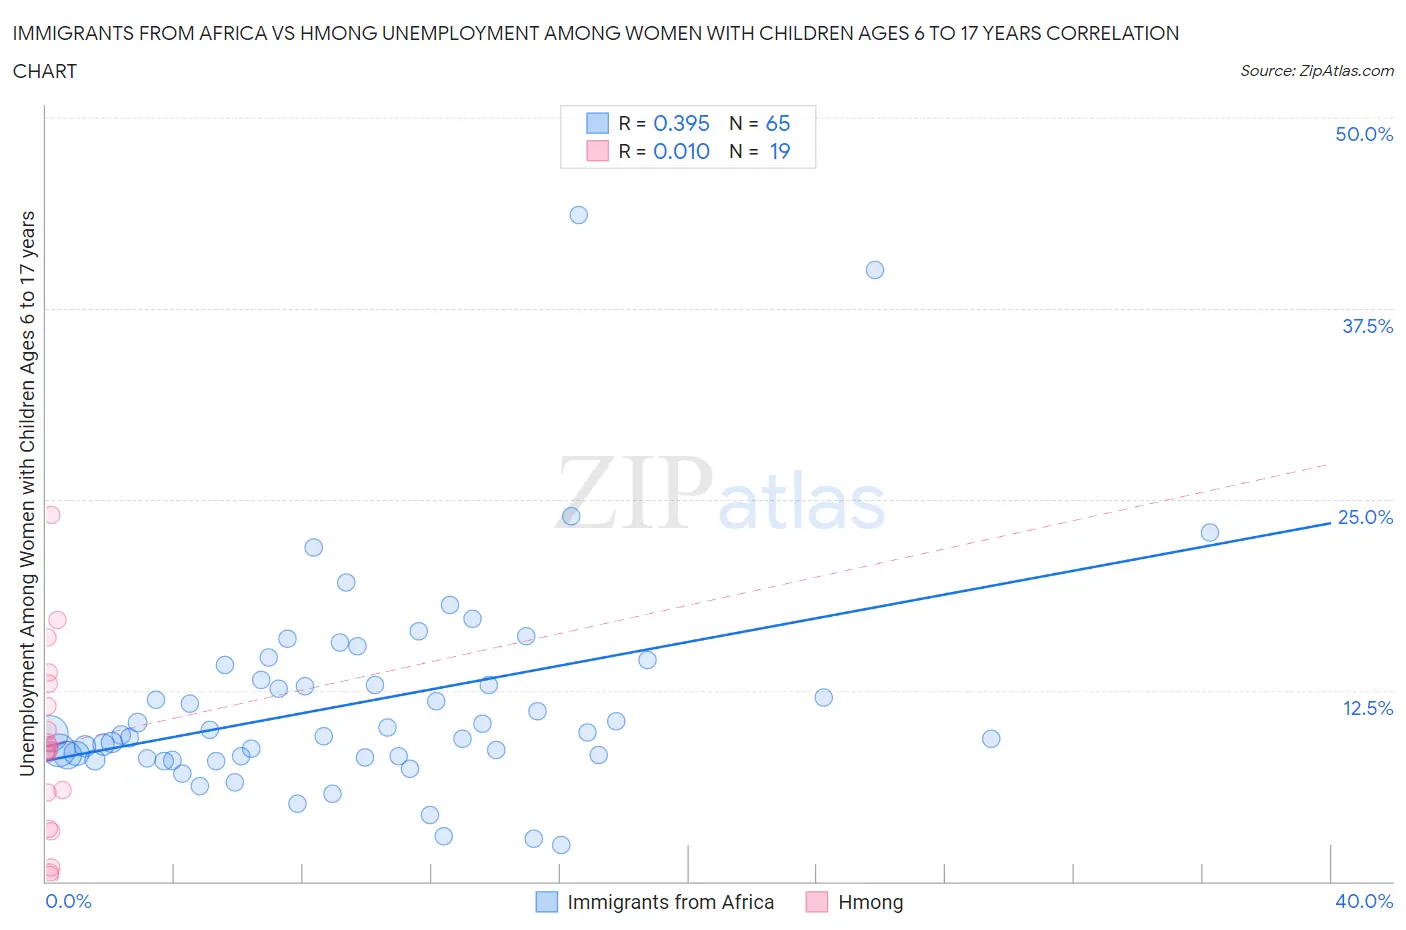
Immigrants from Africa vs Hmong Unemployment Among Women with Children Ages 6 to 17 years Correlation Chart
The statistical analysis conducted on geographies consisting of 326,826,786 people shows a mild positive correlation between the proportion of Immigrants from Africa and unemployment rate among women with children between the ages 6 and 17 in the United States with a correlation coefficient (R) of 0.395 and weighted average of 9.4%. Similarly, the statistical analysis conducted on geographies consisting of 23,659,268 people shows no correlation between the proportion of Hmong and unemployment rate among women with children between the ages 6 and 17 in the United States with a correlation coefficient (R) of 0.010 and weighted average of 8.7%, a difference of 8.0%.
Unemployment Among Women with Children Ages 6 to 17 years Correlation Summary
| Measurement | Immigrants from Africa | Hmong |
| Minimum | 2.4% | 0.40% |
| Maximum | 43.6% | 24.0% |
| Range | 41.2% | 23.6% |
| Mean | 11.7% | 8.9% |
| Median | 9.6% | 8.6% |
| Interquartile 25% (IQ1) | 8.1% | 3.4% |
| Interquartile 75% (IQ3) | 13.7% | 13.0% |
| Interquartile Range (IQR) | 5.5% | 9.6% |
| Standard Deviation (Sample) | 7.0% | 6.1% |
| Standard Deviation (Population) | 7.0% | 6.0% |
Similar Demographics by Unemployment Among Women with Children Ages 6 to 17 years
Demographics Similar to Immigrants from Africa by Unemployment Among Women with Children Ages 6 to 17 years
In terms of unemployment among women with children ages 6 to 17 years, the demographic groups most similar to Immigrants from Africa are Polish (9.4%, a difference of 0.030%), Dutch (9.4%, a difference of 0.070%), Immigrants from South America (9.4%, a difference of 0.080%), Immigrants from Cameroon (9.4%, a difference of 0.17%), and Immigrants from Guatemala (9.4%, a difference of 0.17%).
| Demographics | Rating | Rank | Unemployment Among Women with Children Ages 6 to 17 years |
| Immigrants | Saudi Arabia | 2.7 /100 | #239 | Tragic 9.3% |
| Guatemalans | 2.3 /100 | #240 | Tragic 9.3% |
| Colombians | 2.2 /100 | #241 | Tragic 9.3% |
| Immigrants | Colombia | 2.1 /100 | #242 | Tragic 9.3% |
| Scottish | 2.0 /100 | #243 | Tragic 9.4% |
| English | 1.9 /100 | #244 | Tragic 9.4% |
| Immigrants | Cameroon | 1.8 /100 | #245 | Tragic 9.4% |
| Immigrants | Africa | 1.6 /100 | #246 | Tragic 9.4% |
| Poles | 1.5 /100 | #247 | Tragic 9.4% |
| Dutch | 1.5 /100 | #248 | Tragic 9.4% |
| Immigrants | South America | 1.5 /100 | #249 | Tragic 9.4% |
| Immigrants | Guatemala | 1.3 /100 | #250 | Tragic 9.4% |
| Central Americans | 1.3 /100 | #251 | Tragic 9.4% |
| Creek | 1.2 /100 | #252 | Tragic 9.4% |
| Portuguese | 1.1 /100 | #253 | Tragic 9.4% |
Demographics Similar to Hmong by Unemployment Among Women with Children Ages 6 to 17 years
In terms of unemployment among women with children ages 6 to 17 years, the demographic groups most similar to Hmong are Czech (8.7%, a difference of 0.020%), Immigrants from Northern Africa (8.7%, a difference of 0.030%), South African (8.7%, a difference of 0.050%), Barbadian (8.7%, a difference of 0.10%), and Immigrants from Morocco (8.7%, a difference of 0.12%).
| Demographics | Rating | Rank | Unemployment Among Women with Children Ages 6 to 17 years |
| Immigrants | Denmark | 95.5 /100 | #121 | Exceptional 8.7% |
| Immigrants | Egypt | 95.0 /100 | #122 | Exceptional 8.7% |
| Immigrants | Morocco | 94.9 /100 | #123 | Exceptional 8.7% |
| Immigrants | Lebanon | 94.9 /100 | #124 | Exceptional 8.7% |
| South Africans | 94.6 /100 | #125 | Exceptional 8.7% |
| Immigrants | Northern Africa | 94.4 /100 | #126 | Exceptional 8.7% |
| Czechs | 94.4 /100 | #127 | Exceptional 8.7% |
| Hmong | 94.3 /100 | #128 | Exceptional 8.7% |
| Barbadians | 93.8 /100 | #129 | Exceptional 8.7% |
| Immigrants | Western Asia | 93.1 /100 | #130 | Exceptional 8.7% |
| Slavs | 92.2 /100 | #131 | Exceptional 8.7% |
| Yaqui | 92.2 /100 | #132 | Exceptional 8.7% |
| Egyptians | 91.8 /100 | #133 | Exceptional 8.7% |
| Immigrants | Ireland | 91.0 /100 | #134 | Exceptional 8.7% |
| Europeans | 90.6 /100 | #135 | Exceptional 8.7% |