Immigrants from Africa vs Nepalese Unemployment Among Women with Children Ages 6 to 17 years
COMPARE
Immigrants from Africa
Nepalese
Unemployment Among Women with Children Ages 6 to 17 years
Unemployment Among Women with Children Ages 6 to 17 years Comparison
Immigrants from Africa
Nepalese
9.4%
UNEMPLOYMENT AMONG WOMEN WITH CHILDREN AGES 6 TO 17 YEARS
1.6/ 100
METRIC RATING
246th/ 347
METRIC RANK
7.7%
UNEMPLOYMENT AMONG WOMEN WITH CHILDREN AGES 6 TO 17 YEARS
100.0/ 100
METRIC RATING
24th/ 347
METRIC RANK
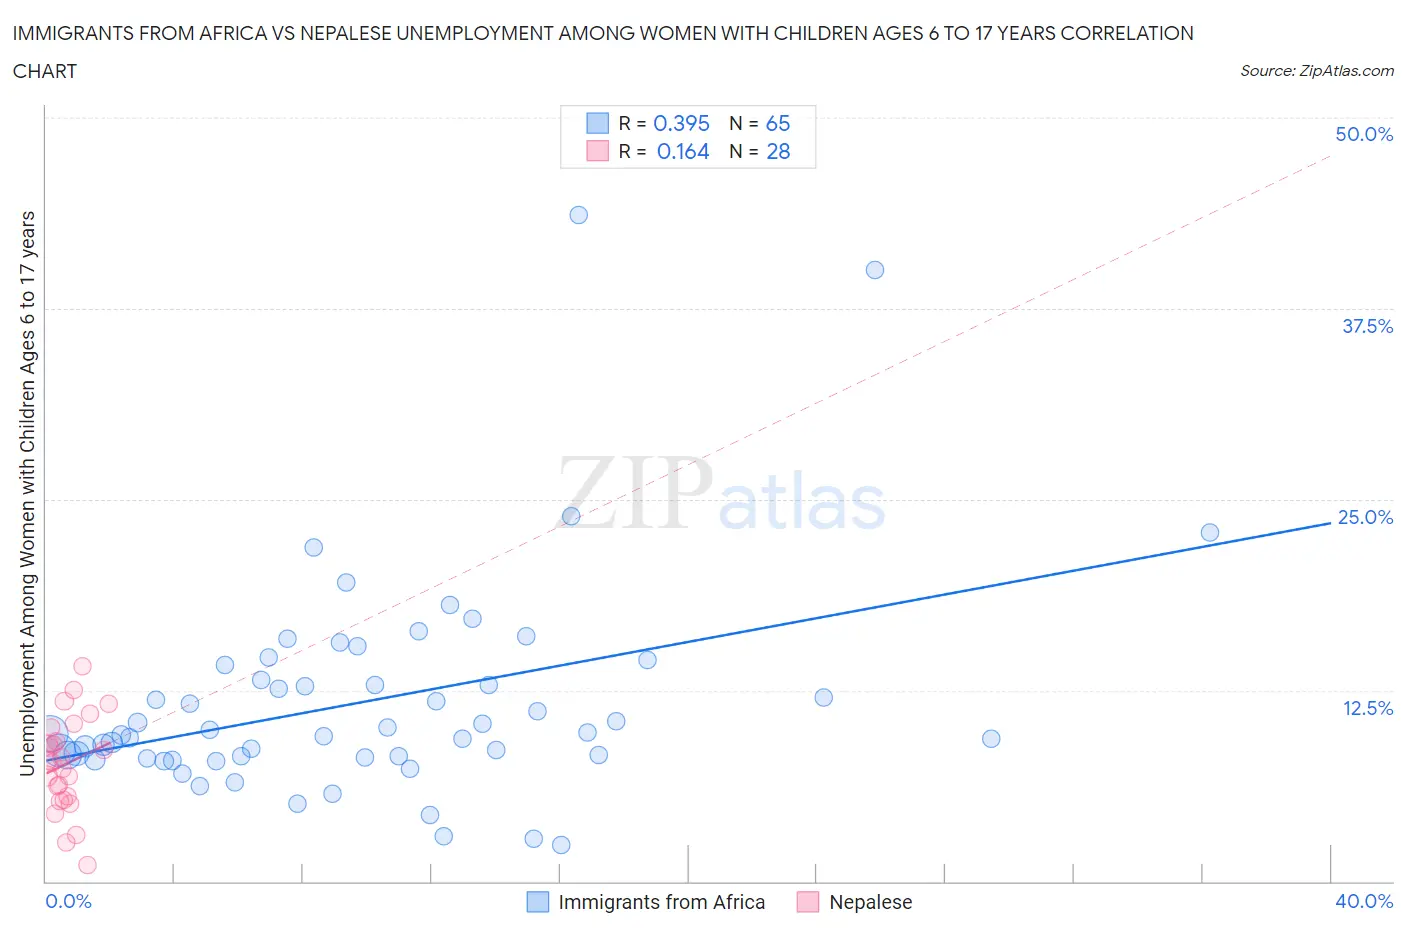
Immigrants from Africa vs Nepalese Unemployment Among Women with Children Ages 6 to 17 years Correlation Chart
The statistical analysis conducted on geographies consisting of 326,826,786 people shows a mild positive correlation between the proportion of Immigrants from Africa and unemployment rate among women with children between the ages 6 and 17 in the United States with a correlation coefficient (R) of 0.395 and weighted average of 9.4%. Similarly, the statistical analysis conducted on geographies consisting of 22,673,047 people shows a poor positive correlation between the proportion of Nepalese and unemployment rate among women with children between the ages 6 and 17 in the United States with a correlation coefficient (R) of 0.164 and weighted average of 7.7%, a difference of 21.5%.
Unemployment Among Women with Children Ages 6 to 17 years Correlation Summary
| Measurement | Immigrants from Africa | Nepalese |
| Minimum | 2.4% | 1.1% |
| Maximum | 43.6% | 14.1% |
| Range | 41.2% | 13.0% |
| Mean | 11.7% | 7.7% |
| Median | 9.6% | 7.9% |
| Interquartile 25% (IQ1) | 8.1% | 5.4% |
| Interquartile 75% (IQ3) | 13.7% | 9.6% |
| Interquartile Range (IQR) | 5.5% | 4.2% |
| Standard Deviation (Sample) | 7.0% | 3.1% |
| Standard Deviation (Population) | 7.0% | 3.0% |
Similar Demographics by Unemployment Among Women with Children Ages 6 to 17 years
Demographics Similar to Immigrants from Africa by Unemployment Among Women with Children Ages 6 to 17 years
In terms of unemployment among women with children ages 6 to 17 years, the demographic groups most similar to Immigrants from Africa are Polish (9.4%, a difference of 0.030%), Dutch (9.4%, a difference of 0.070%), Immigrants from South America (9.4%, a difference of 0.080%), Immigrants from Cameroon (9.4%, a difference of 0.17%), and Immigrants from Guatemala (9.4%, a difference of 0.17%).
| Demographics | Rating | Rank | Unemployment Among Women with Children Ages 6 to 17 years |
| Immigrants | Saudi Arabia | 2.7 /100 | #239 | Tragic 9.3% |
| Guatemalans | 2.3 /100 | #240 | Tragic 9.3% |
| Colombians | 2.2 /100 | #241 | Tragic 9.3% |
| Immigrants | Colombia | 2.1 /100 | #242 | Tragic 9.3% |
| Scottish | 2.0 /100 | #243 | Tragic 9.4% |
| English | 1.9 /100 | #244 | Tragic 9.4% |
| Immigrants | Cameroon | 1.8 /100 | #245 | Tragic 9.4% |
| Immigrants | Africa | 1.6 /100 | #246 | Tragic 9.4% |
| Poles | 1.5 /100 | #247 | Tragic 9.4% |
| Dutch | 1.5 /100 | #248 | Tragic 9.4% |
| Immigrants | South America | 1.5 /100 | #249 | Tragic 9.4% |
| Immigrants | Guatemala | 1.3 /100 | #250 | Tragic 9.4% |
| Central Americans | 1.3 /100 | #251 | Tragic 9.4% |
| Creek | 1.2 /100 | #252 | Tragic 9.4% |
| Portuguese | 1.1 /100 | #253 | Tragic 9.4% |
Demographics Similar to Nepalese by Unemployment Among Women with Children Ages 6 to 17 years
In terms of unemployment among women with children ages 6 to 17 years, the demographic groups most similar to Nepalese are Immigrants from Indonesia (7.7%, a difference of 0.010%), Immigrants from Eastern Asia (7.7%, a difference of 0.12%), Indian (Asian) (7.7%, a difference of 0.13%), Immigrants from China (7.7%, a difference of 0.39%), and Immigrants from India (7.7%, a difference of 0.68%).
| Demographics | Rating | Rank | Unemployment Among Women with Children Ages 6 to 17 years |
| Cambodians | 100.0 /100 | #17 | Exceptional 7.5% |
| Afghans | 100.0 /100 | #18 | Exceptional 7.6% |
| Filipinos | 100.0 /100 | #19 | Exceptional 7.6% |
| Immigrants | Singapore | 100.0 /100 | #20 | Exceptional 7.7% |
| Immigrants | India | 100.0 /100 | #21 | Exceptional 7.7% |
| Immigrants | China | 100.0 /100 | #22 | Exceptional 7.7% |
| Immigrants | Indonesia | 100.0 /100 | #23 | Exceptional 7.7% |
| Nepalese | 100.0 /100 | #24 | Exceptional 7.7% |
| Immigrants | Eastern Asia | 100.0 /100 | #25 | Exceptional 7.7% |
| Indians (Asian) | 100.0 /100 | #26 | Exceptional 7.7% |
| Immigrants | Afghanistan | 100.0 /100 | #27 | Exceptional 7.8% |
| Immigrants | Uzbekistan | 100.0 /100 | #28 | Exceptional 7.8% |
| Thais | 100.0 /100 | #29 | Exceptional 7.8% |
| Immigrants | Iran | 100.0 /100 | #30 | Exceptional 7.9% |
| Laotians | 100.0 /100 | #31 | Exceptional 7.9% |