Icelander vs Immigrants from Zaire Female Unemployment
COMPARE
Icelander
Immigrants from Zaire
Female Unemployment
Female Unemployment Comparison
Icelanders
Immigrants from Zaire
4.9%
FEMALE UNEMPLOYMENT
98.8/ 100
METRIC RATING
57th/ 347
METRIC RANK
5.0%
FEMALE UNEMPLOYMENT
95.2/ 100
METRIC RATING
99th/ 347
METRIC RANK
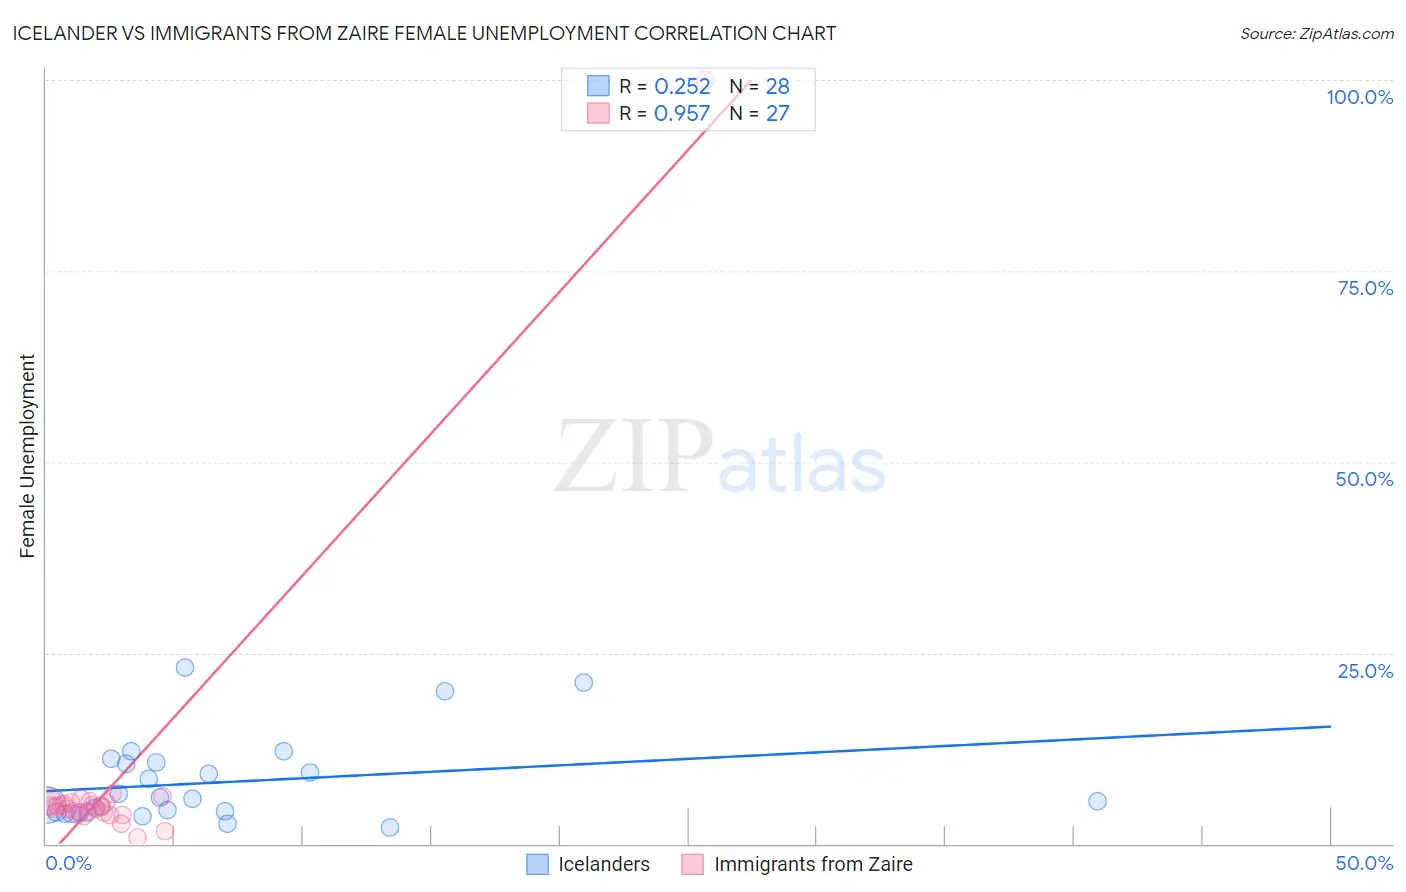
Icelander vs Immigrants from Zaire Female Unemployment Correlation Chart
The statistical analysis conducted on geographies consisting of 159,215,997 people shows a weak positive correlation between the proportion of Icelanders and unemploymnet rate among females in the United States with a correlation coefficient (R) of 0.252 and weighted average of 4.9%. Similarly, the statistical analysis conducted on geographies consisting of 107,156,067 people shows a perfect positive correlation between the proportion of Immigrants from Zaire and unemploymnet rate among females in the United States with a correlation coefficient (R) of 0.957 and weighted average of 5.0%, a difference of 2.3%.
Female Unemployment Correlation Summary
| Measurement | Icelander | Immigrants from Zaire |
| Minimum | 2.2% | 0.80% |
| Maximum | 23.1% | 100.0% |
| Range | 20.9% | 99.2% |
| Mean | 8.0% | 8.0% |
| Median | 5.8% | 4.8% |
| Interquartile 25% (IQ1) | 4.1% | 3.8% |
| Interquartile 75% (IQ3) | 10.6% | 5.4% |
| Interquartile Range (IQR) | 6.5% | 1.6% |
| Standard Deviation (Sample) | 5.6% | 18.4% |
| Standard Deviation (Population) | 5.5% | 18.1% |
Similar Demographics by Female Unemployment
Demographics Similar to Icelanders by Female Unemployment
In terms of female unemployment, the demographic groups most similar to Icelanders are Immigrants from Lithuania (4.9%, a difference of 0.090%), Bhutanese (4.9%, a difference of 0.21%), Serbian (4.9%, a difference of 0.24%), Immigrants from Moldova (4.9%, a difference of 0.25%), and Immigrants from Zimbabwe (4.9%, a difference of 0.27%).
| Demographics | Rating | Rank | Female Unemployment |
| Immigrants | Cuba | 99.1 /100 | #50 | Exceptional 4.9% |
| Cambodians | 99.1 /100 | #51 | Exceptional 4.9% |
| Slavs | 99.1 /100 | #52 | Exceptional 4.9% |
| Whites/Caucasians | 99.0 /100 | #53 | Exceptional 4.9% |
| Immigrants | Zimbabwe | 99.0 /100 | #54 | Exceptional 4.9% |
| Immigrants | Moldova | 99.0 /100 | #55 | Exceptional 4.9% |
| Serbians | 99.0 /100 | #56 | Exceptional 4.9% |
| Icelanders | 98.8 /100 | #57 | Exceptional 4.9% |
| Immigrants | Lithuania | 98.8 /100 | #58 | Exceptional 4.9% |
| Bhutanese | 98.7 /100 | #59 | Exceptional 4.9% |
| Immigrants | Scotland | 98.6 /100 | #60 | Exceptional 4.9% |
| Immigrants | Canada | 98.6 /100 | #61 | Exceptional 4.9% |
| Immigrants | Nepal | 98.6 /100 | #62 | Exceptional 4.9% |
| Immigrants | Belgium | 98.5 /100 | #63 | Exceptional 4.9% |
| Celtics | 98.5 /100 | #64 | Exceptional 4.9% |
Demographics Similar to Immigrants from Zaire by Female Unemployment
In terms of female unemployment, the demographic groups most similar to Immigrants from Zaire are Immigrants from Somalia (5.0%, a difference of 0.010%), Immigrants from Kuwait (5.0%, a difference of 0.010%), Indonesian (5.0%, a difference of 0.020%), Immigrants from Czechoslovakia (5.0%, a difference of 0.060%), and Immigrants from South Central Asia (5.0%, a difference of 0.12%).
| Demographics | Rating | Rank | Female Unemployment |
| Romanians | 95.9 /100 | #92 | Exceptional 5.0% |
| Immigrants | Austria | 95.7 /100 | #93 | Exceptional 5.0% |
| Immigrants | Malaysia | 95.7 /100 | #94 | Exceptional 5.0% |
| Burmese | 95.6 /100 | #95 | Exceptional 5.0% |
| Immigrants | South Central Asia | 95.5 /100 | #96 | Exceptional 5.0% |
| Immigrants | Somalia | 95.2 /100 | #97 | Exceptional 5.0% |
| Immigrants | Kuwait | 95.2 /100 | #98 | Exceptional 5.0% |
| Immigrants | Zaire | 95.2 /100 | #99 | Exceptional 5.0% |
| Indonesians | 95.1 /100 | #100 | Exceptional 5.0% |
| Immigrants | Czechoslovakia | 95.0 /100 | #101 | Exceptional 5.0% |
| Immigrants | Kenya | 94.8 /100 | #102 | Exceptional 5.0% |
| Somalis | 94.6 /100 | #103 | Exceptional 5.0% |
| Kenyans | 93.7 /100 | #104 | Exceptional 5.0% |
| Immigrants | England | 93.6 /100 | #105 | Exceptional 5.0% |
| Paraguayans | 93.2 /100 | #106 | Exceptional 5.1% |