Icelander vs Spanish American Female Unemployment
COMPARE
Icelander
Spanish American
Female Unemployment
Female Unemployment Comparison
Icelanders
Spanish Americans
4.9%
FEMALE UNEMPLOYMENT
98.8/ 100
METRIC RATING
57th/ 347
METRIC RANK
5.6%
FEMALE UNEMPLOYMENT
2.2/ 100
METRIC RATING
243rd/ 347
METRIC RANK
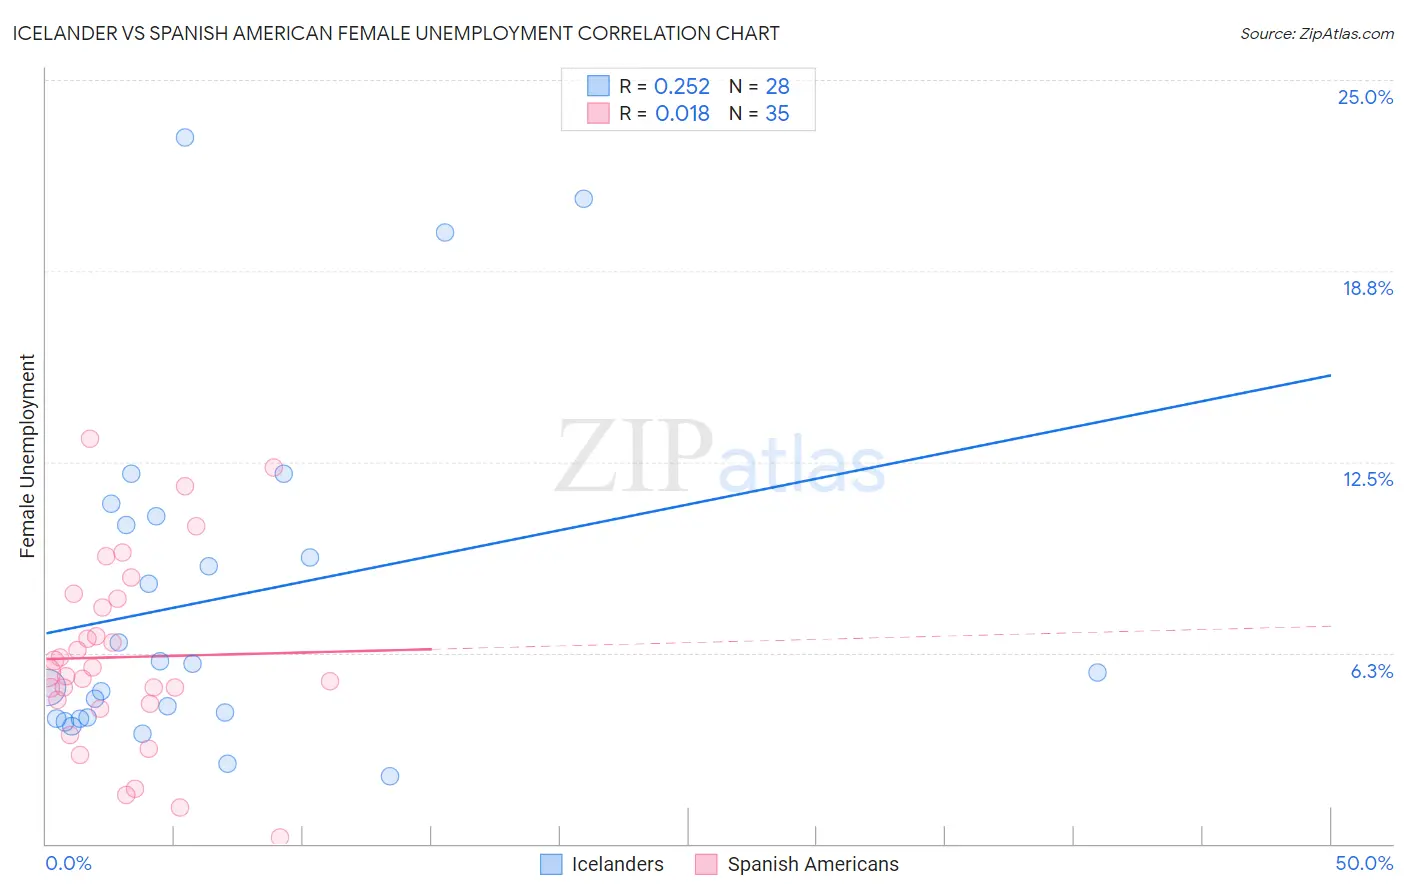
Icelander vs Spanish American Female Unemployment Correlation Chart
The statistical analysis conducted on geographies consisting of 159,215,997 people shows a weak positive correlation between the proportion of Icelanders and unemploymnet rate among females in the United States with a correlation coefficient (R) of 0.252 and weighted average of 4.9%. Similarly, the statistical analysis conducted on geographies consisting of 103,055,581 people shows no correlation between the proportion of Spanish Americans and unemploymnet rate among females in the United States with a correlation coefficient (R) of 0.018 and weighted average of 5.6%, a difference of 13.2%.
Female Unemployment Correlation Summary
| Measurement | Icelander | Spanish American |
| Minimum | 2.2% | 0.20% |
| Maximum | 23.1% | 13.3% |
| Range | 20.9% | 13.1% |
| Mean | 8.0% | 6.1% |
| Median | 5.8% | 5.6% |
| Interquartile 25% (IQ1) | 4.1% | 4.6% |
| Interquartile 75% (IQ3) | 10.6% | 8.0% |
| Interquartile Range (IQR) | 6.5% | 3.4% |
| Standard Deviation (Sample) | 5.6% | 3.1% |
| Standard Deviation (Population) | 5.5% | 3.0% |
Similar Demographics by Female Unemployment
Demographics Similar to Icelanders by Female Unemployment
In terms of female unemployment, the demographic groups most similar to Icelanders are Immigrants from Lithuania (4.9%, a difference of 0.090%), Bhutanese (4.9%, a difference of 0.21%), Serbian (4.9%, a difference of 0.24%), Immigrants from Moldova (4.9%, a difference of 0.25%), and Immigrants from Zimbabwe (4.9%, a difference of 0.27%).
| Demographics | Rating | Rank | Female Unemployment |
| Immigrants | Cuba | 99.1 /100 | #50 | Exceptional 4.9% |
| Cambodians | 99.1 /100 | #51 | Exceptional 4.9% |
| Slavs | 99.1 /100 | #52 | Exceptional 4.9% |
| Whites/Caucasians | 99.0 /100 | #53 | Exceptional 4.9% |
| Immigrants | Zimbabwe | 99.0 /100 | #54 | Exceptional 4.9% |
| Immigrants | Moldova | 99.0 /100 | #55 | Exceptional 4.9% |
| Serbians | 99.0 /100 | #56 | Exceptional 4.9% |
| Icelanders | 98.8 /100 | #57 | Exceptional 4.9% |
| Immigrants | Lithuania | 98.8 /100 | #58 | Exceptional 4.9% |
| Bhutanese | 98.7 /100 | #59 | Exceptional 4.9% |
| Immigrants | Scotland | 98.6 /100 | #60 | Exceptional 4.9% |
| Immigrants | Canada | 98.6 /100 | #61 | Exceptional 4.9% |
| Immigrants | Nepal | 98.6 /100 | #62 | Exceptional 4.9% |
| Immigrants | Belgium | 98.5 /100 | #63 | Exceptional 4.9% |
| Celtics | 98.5 /100 | #64 | Exceptional 4.9% |
Demographics Similar to Spanish Americans by Female Unemployment
In terms of female unemployment, the demographic groups most similar to Spanish Americans are Marshallese (5.6%, a difference of 0.010%), South American Indian (5.5%, a difference of 0.32%), Immigrants from South America (5.5%, a difference of 0.37%), Aleut (5.5%, a difference of 0.41%), and Sierra Leonean (5.5%, a difference of 0.51%).
| Demographics | Rating | Rank | Female Unemployment |
| Immigrants | Cambodia | 3.3 /100 | #236 | Tragic 5.5% |
| Immigrants | Panama | 3.2 /100 | #237 | Tragic 5.5% |
| Sierra Leoneans | 3.2 /100 | #238 | Tragic 5.5% |
| Aleuts | 3.0 /100 | #239 | Tragic 5.5% |
| Immigrants | South America | 2.9 /100 | #240 | Tragic 5.5% |
| South American Indians | 2.8 /100 | #241 | Tragic 5.5% |
| Marshallese | 2.3 /100 | #242 | Tragic 5.6% |
| Spanish Americans | 2.2 /100 | #243 | Tragic 5.6% |
| Immigrants | Liberia | 1.5 /100 | #244 | Tragic 5.6% |
| Guamanians/Chamorros | 1.4 /100 | #245 | Tragic 5.6% |
| Japanese | 1.2 /100 | #246 | Tragic 5.6% |
| Immigrants | Western Asia | 1.1 /100 | #247 | Tragic 5.6% |
| Cree | 1.0 /100 | #248 | Tragic 5.6% |
| Immigrants | Uzbekistan | 1.0 /100 | #249 | Tragic 5.6% |
| Immigrants | Syria | 0.8 /100 | #250 | Tragic 5.6% |