Icelander vs Czech Female Unemployment
COMPARE
Icelander
Czech
Female Unemployment
Female Unemployment Comparison
Icelanders
Czechs
4.9%
FEMALE UNEMPLOYMENT
98.8/ 100
METRIC RATING
57th/ 347
METRIC RANK
4.4%
FEMALE UNEMPLOYMENT
100.0/ 100
METRIC RATING
2nd/ 347
METRIC RANK
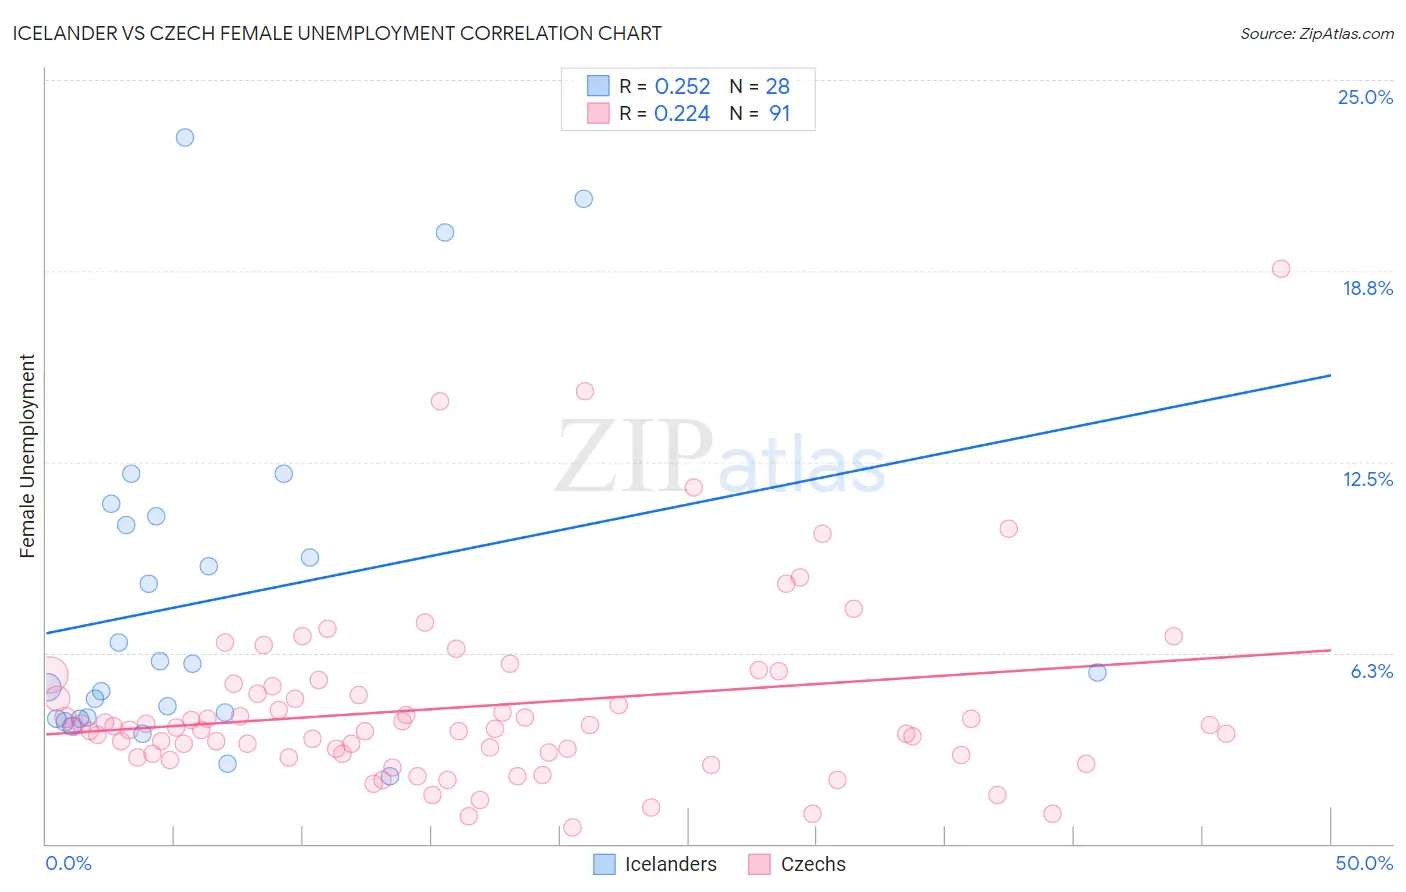
Icelander vs Czech Female Unemployment Correlation Chart
The statistical analysis conducted on geographies consisting of 159,215,997 people shows a weak positive correlation between the proportion of Icelanders and unemploymnet rate among females in the United States with a correlation coefficient (R) of 0.252 and weighted average of 4.9%. Similarly, the statistical analysis conducted on geographies consisting of 478,075,637 people shows a weak positive correlation between the proportion of Czechs and unemploymnet rate among females in the United States with a correlation coefficient (R) of 0.224 and weighted average of 4.4%, a difference of 11.8%.
Female Unemployment Correlation Summary
| Measurement | Icelander | Czech |
| Minimum | 2.2% | 0.54% |
| Maximum | 23.1% | 18.8% |
| Range | 20.9% | 18.3% |
| Mean | 8.0% | 4.5% |
| Median | 5.8% | 3.8% |
| Interquartile 25% (IQ1) | 4.1% | 3.0% |
| Interquartile 75% (IQ3) | 10.6% | 5.1% |
| Interquartile Range (IQR) | 6.5% | 2.2% |
| Standard Deviation (Sample) | 5.6% | 3.0% |
| Standard Deviation (Population) | 5.5% | 3.0% |
Similar Demographics by Female Unemployment
Demographics Similar to Icelanders by Female Unemployment
In terms of female unemployment, the demographic groups most similar to Icelanders are Immigrants from Lithuania (4.9%, a difference of 0.090%), Bhutanese (4.9%, a difference of 0.21%), Serbian (4.9%, a difference of 0.24%), Immigrants from Moldova (4.9%, a difference of 0.25%), and Immigrants from Zimbabwe (4.9%, a difference of 0.27%).
| Demographics | Rating | Rank | Female Unemployment |
| Immigrants | Cuba | 99.1 /100 | #50 | Exceptional 4.9% |
| Cambodians | 99.1 /100 | #51 | Exceptional 4.9% |
| Slavs | 99.1 /100 | #52 | Exceptional 4.9% |
| Whites/Caucasians | 99.0 /100 | #53 | Exceptional 4.9% |
| Immigrants | Zimbabwe | 99.0 /100 | #54 | Exceptional 4.9% |
| Immigrants | Moldova | 99.0 /100 | #55 | Exceptional 4.9% |
| Serbians | 99.0 /100 | #56 | Exceptional 4.9% |
| Icelanders | 98.8 /100 | #57 | Exceptional 4.9% |
| Immigrants | Lithuania | 98.8 /100 | #58 | Exceptional 4.9% |
| Bhutanese | 98.7 /100 | #59 | Exceptional 4.9% |
| Immigrants | Scotland | 98.6 /100 | #60 | Exceptional 4.9% |
| Immigrants | Canada | 98.6 /100 | #61 | Exceptional 4.9% |
| Immigrants | Nepal | 98.6 /100 | #62 | Exceptional 4.9% |
| Immigrants | Belgium | 98.5 /100 | #63 | Exceptional 4.9% |
| Celtics | 98.5 /100 | #64 | Exceptional 4.9% |
Demographics Similar to Czechs by Female Unemployment
In terms of female unemployment, the demographic groups most similar to Czechs are Luxembourger (4.4%, a difference of 0.010%), Danish (4.4%, a difference of 0.040%), Hmong (4.4%, a difference of 0.15%), Swedish (4.4%, a difference of 1.4%), and Chinese (4.5%, a difference of 2.2%).
| Demographics | Rating | Rank | Female Unemployment |
| Norwegians | 100.0 /100 | #1 | Exceptional 4.2% |
| Czechs | 100.0 /100 | #2 | Exceptional 4.4% |
| Luxembourgers | 100.0 /100 | #3 | Exceptional 4.4% |
| Danes | 100.0 /100 | #4 | Exceptional 4.4% |
| Hmong | 100.0 /100 | #5 | Exceptional 4.4% |
| Swedes | 100.0 /100 | #6 | Exceptional 4.4% |
| Chinese | 100.0 /100 | #7 | Exceptional 4.5% |
| Germans | 100.0 /100 | #8 | Exceptional 4.5% |
| Slovenes | 100.0 /100 | #9 | Exceptional 4.5% |
| Swiss | 100.0 /100 | #10 | Exceptional 4.6% |
| Scandinavians | 100.0 /100 | #11 | Exceptional 4.6% |
| Dutch | 100.0 /100 | #12 | Exceptional 4.6% |
| Belgians | 100.0 /100 | #13 | Exceptional 4.6% |
| Finns | 100.0 /100 | #14 | Exceptional 4.6% |
| English | 100.0 /100 | #15 | Exceptional 4.6% |