Icelander vs Canadian Female Unemployment
COMPARE
Icelander
Canadian
Female Unemployment
Female Unemployment Comparison
Icelanders
Canadians
4.9%
FEMALE UNEMPLOYMENT
98.8/ 100
METRIC RATING
57th/ 347
METRIC RANK
5.0%
FEMALE UNEMPLOYMENT
97.2/ 100
METRIC RATING
84th/ 347
METRIC RANK
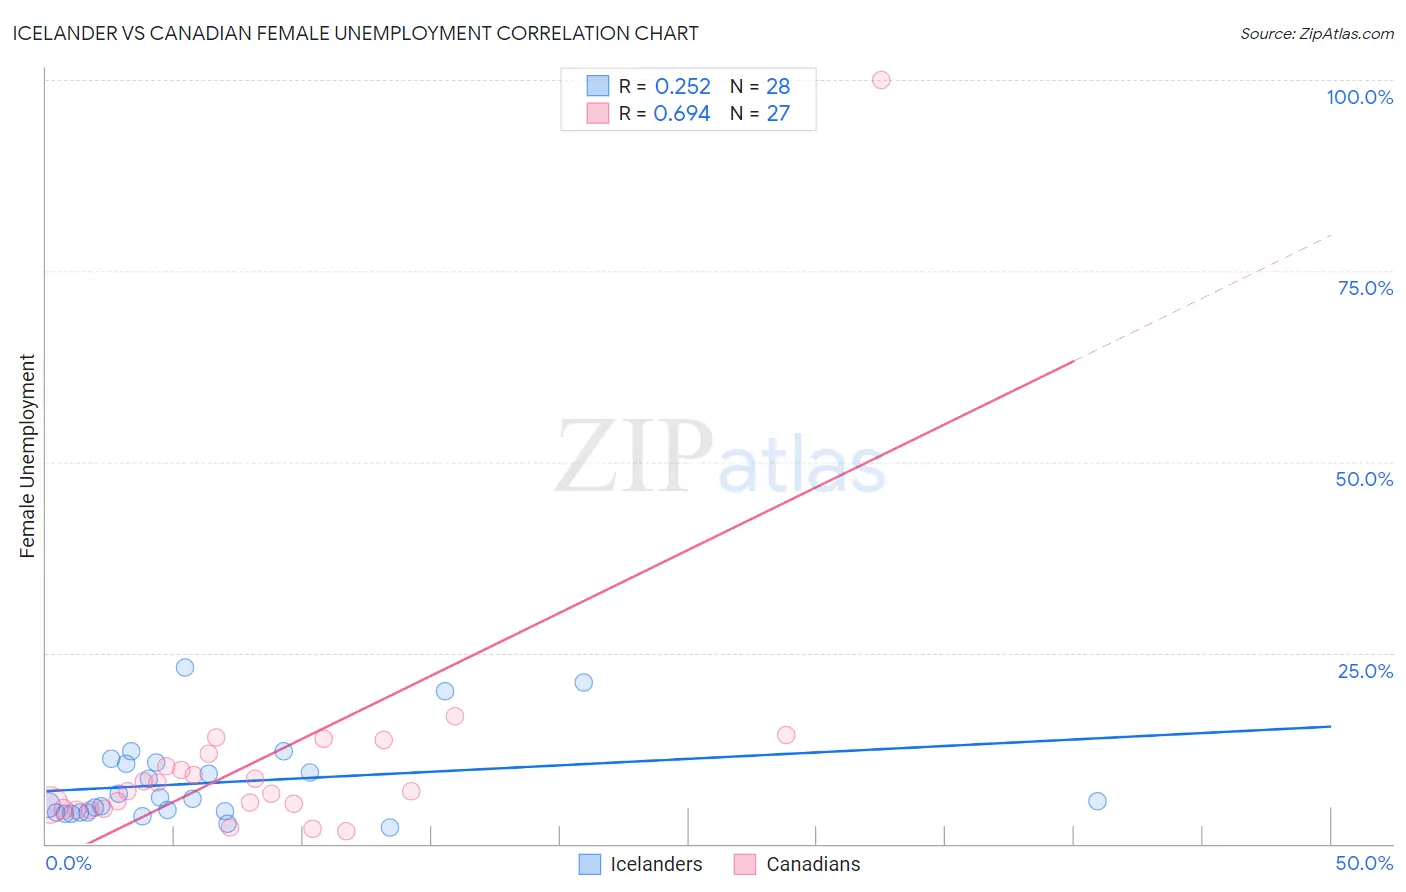
Icelander vs Canadian Female Unemployment Correlation Chart
The statistical analysis conducted on geographies consisting of 159,215,997 people shows a weak positive correlation between the proportion of Icelanders and unemploymnet rate among females in the United States with a correlation coefficient (R) of 0.252 and weighted average of 4.9%. Similarly, the statistical analysis conducted on geographies consisting of 433,816,677 people shows a significant positive correlation between the proportion of Canadians and unemploymnet rate among females in the United States with a correlation coefficient (R) of 0.694 and weighted average of 5.0%, a difference of 1.4%.
Female Unemployment Correlation Summary
| Measurement | Icelander | Canadian |
| Minimum | 2.2% | 1.7% |
| Maximum | 23.1% | 100.0% |
| Range | 20.9% | 98.3% |
| Mean | 8.0% | 11.2% |
| Median | 5.8% | 6.9% |
| Interquartile 25% (IQ1) | 4.1% | 4.5% |
| Interquartile 75% (IQ3) | 10.6% | 11.8% |
| Interquartile Range (IQR) | 6.5% | 7.2% |
| Standard Deviation (Sample) | 5.6% | 18.2% |
| Standard Deviation (Population) | 5.5% | 17.9% |
Similar Demographics by Female Unemployment
Demographics Similar to Icelanders by Female Unemployment
In terms of female unemployment, the demographic groups most similar to Icelanders are Immigrants from Lithuania (4.9%, a difference of 0.090%), Bhutanese (4.9%, a difference of 0.21%), Serbian (4.9%, a difference of 0.24%), Immigrants from Moldova (4.9%, a difference of 0.25%), and Immigrants from Zimbabwe (4.9%, a difference of 0.27%).
| Demographics | Rating | Rank | Female Unemployment |
| Immigrants | Cuba | 99.1 /100 | #50 | Exceptional 4.9% |
| Cambodians | 99.1 /100 | #51 | Exceptional 4.9% |
| Slavs | 99.1 /100 | #52 | Exceptional 4.9% |
| Whites/Caucasians | 99.0 /100 | #53 | Exceptional 4.9% |
| Immigrants | Zimbabwe | 99.0 /100 | #54 | Exceptional 4.9% |
| Immigrants | Moldova | 99.0 /100 | #55 | Exceptional 4.9% |
| Serbians | 99.0 /100 | #56 | Exceptional 4.9% |
| Icelanders | 98.8 /100 | #57 | Exceptional 4.9% |
| Immigrants | Lithuania | 98.8 /100 | #58 | Exceptional 4.9% |
| Bhutanese | 98.7 /100 | #59 | Exceptional 4.9% |
| Immigrants | Scotland | 98.6 /100 | #60 | Exceptional 4.9% |
| Immigrants | Canada | 98.6 /100 | #61 | Exceptional 4.9% |
| Immigrants | Nepal | 98.6 /100 | #62 | Exceptional 4.9% |
| Immigrants | Belgium | 98.5 /100 | #63 | Exceptional 4.9% |
| Celtics | 98.5 /100 | #64 | Exceptional 4.9% |
Demographics Similar to Canadians by Female Unemployment
In terms of female unemployment, the demographic groups most similar to Canadians are Immigrants from Serbia (5.0%, a difference of 0.040%), Ukrainian (5.0%, a difference of 0.040%), Immigrants from Australia (5.0%, a difference of 0.050%), Bolivian (5.0%, a difference of 0.050%), and Filipino (5.0%, a difference of 0.10%).
| Demographics | Rating | Rank | Female Unemployment |
| Mongolians | 97.8 /100 | #77 | Exceptional 5.0% |
| Immigrants | Netherlands | 97.8 /100 | #78 | Exceptional 5.0% |
| Turks | 97.6 /100 | #79 | Exceptional 5.0% |
| New Zealanders | 97.4 /100 | #80 | Exceptional 5.0% |
| Filipinos | 97.3 /100 | #81 | Exceptional 5.0% |
| Immigrants | Australia | 97.3 /100 | #82 | Exceptional 5.0% |
| Immigrants | Serbia | 97.2 /100 | #83 | Exceptional 5.0% |
| Canadians | 97.2 /100 | #84 | Exceptional 5.0% |
| Ukrainians | 97.1 /100 | #85 | Exceptional 5.0% |
| Bolivians | 97.1 /100 | #86 | Exceptional 5.0% |
| Venezuelans | 96.9 /100 | #87 | Exceptional 5.0% |
| Immigrants | Sudan | 96.7 /100 | #88 | Exceptional 5.0% |
| Immigrants | Taiwan | 96.6 /100 | #89 | Exceptional 5.0% |
| Immigrants | Sweden | 96.3 /100 | #90 | Exceptional 5.0% |
| Immigrants | Japan | 96.0 /100 | #91 | Exceptional 5.0% |