Immigrants from Ireland vs Costa Rican Male Unemployment
COMPARE
Immigrants from Ireland
Costa Rican
Male Unemployment
Male Unemployment Comparison
Immigrants from Ireland
Costa Ricans
5.3%
MALE UNEMPLOYMENT
57.7/ 100
METRIC RATING
168th/ 347
METRIC RANK
5.4%
MALE UNEMPLOYMENT
31.3/ 100
METRIC RATING
187th/ 347
METRIC RANK
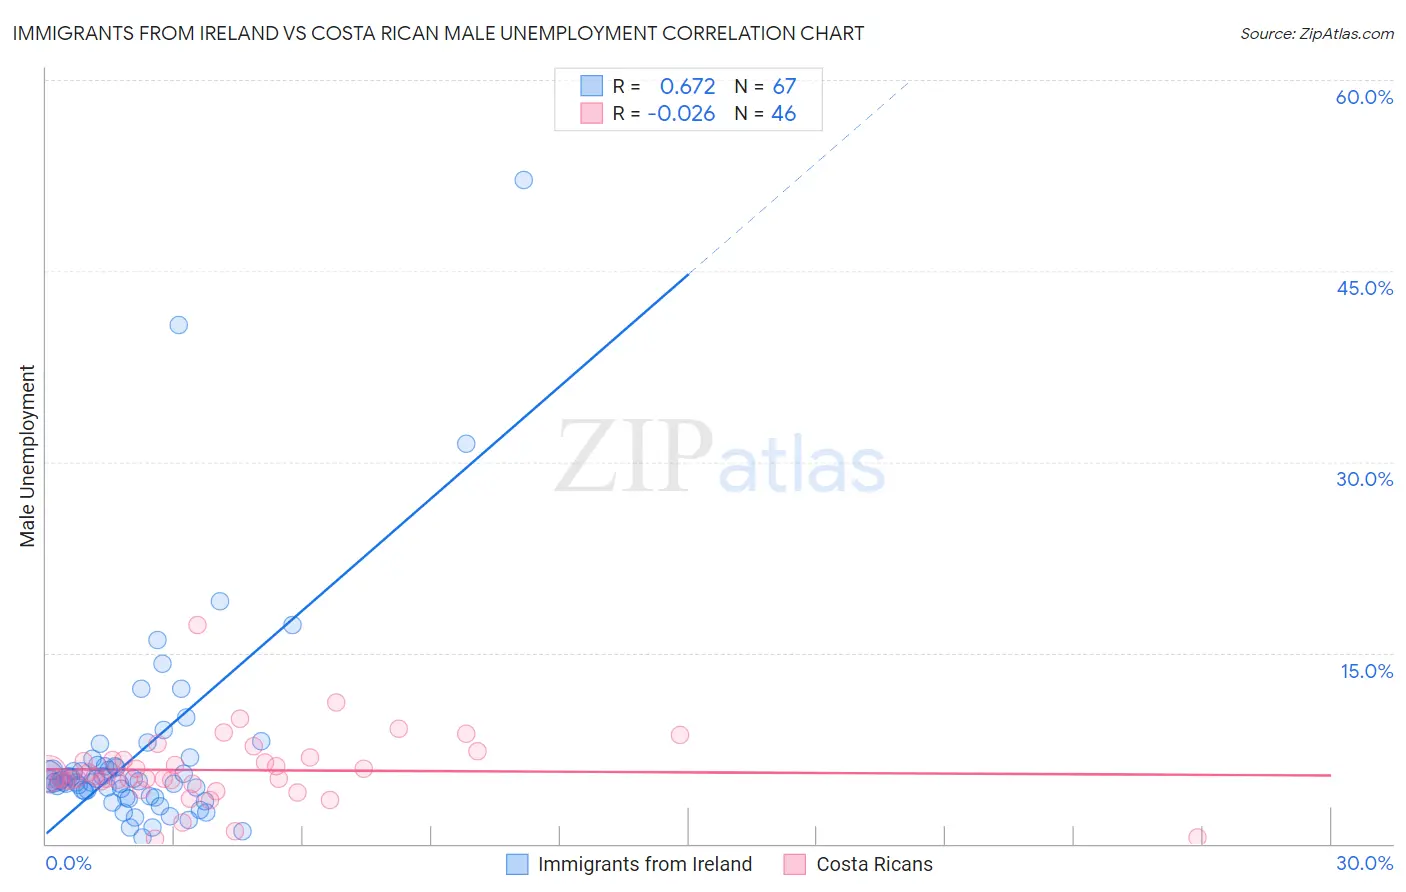
Immigrants from Ireland vs Costa Rican Male Unemployment Correlation Chart
The statistical analysis conducted on geographies consisting of 240,228,125 people shows a significant positive correlation between the proportion of Immigrants from Ireland and unemployment rate among males in the United States with a correlation coefficient (R) of 0.672 and weighted average of 5.3%. Similarly, the statistical analysis conducted on geographies consisting of 253,200,475 people shows no correlation between the proportion of Costa Ricans and unemployment rate among males in the United States with a correlation coefficient (R) of -0.026 and weighted average of 5.4%, a difference of 1.6%.
Male Unemployment Correlation Summary
| Measurement | Immigrants from Ireland | Costa Rican |
| Minimum | 0.50% | 0.35% |
| Maximum | 52.1% | 17.2% |
| Range | 51.6% | 16.8% |
| Mean | 7.2% | 5.8% |
| Median | 4.9% | 5.2% |
| Interquartile 25% (IQ1) | 3.7% | 4.9% |
| Interquartile 75% (IQ3) | 6.2% | 6.6% |
| Interquartile Range (IQR) | 2.5% | 1.8% |
| Standard Deviation (Sample) | 8.5% | 2.8% |
| Standard Deviation (Population) | 8.4% | 2.8% |
Demographics Similar to Immigrants from Ireland and Costa Ricans by Male Unemployment
In terms of male unemployment, the demographic groups most similar to Immigrants from Ireland are Immigrants from Vietnam (5.3%, a difference of 0.020%), Immigrants from Congo (5.3%, a difference of 0.020%), Immigrants from Eastern Europe (5.3%, a difference of 0.22%), Peruvian (5.3%, a difference of 0.35%), and Immigrants from Kazakhstan (5.3%, a difference of 0.41%). Similarly, the demographic groups most similar to Costa Ricans are Iraqi (5.4%, a difference of 0.010%), Korean (5.3%, a difference of 0.23%), Spaniard (5.3%, a difference of 0.24%), Taiwanese (5.3%, a difference of 0.40%), and Immigrants from Afghanistan (5.3%, a difference of 0.42%).
| Demographics | Rating | Rank | Male Unemployment |
| Immigrants | Vietnam | 58.1 /100 | #167 | Average 5.3% |
| Immigrants | Ireland | 57.7 /100 | #168 | Average 5.3% |
| Immigrants | Congo | 57.4 /100 | #169 | Average 5.3% |
| Immigrants | Eastern Europe | 54.1 /100 | #170 | Average 5.3% |
| Peruvians | 51.9 /100 | #171 | Average 5.3% |
| Immigrants | Kazakhstan | 50.8 /100 | #172 | Average 5.3% |
| Immigrants | Russia | 50.7 /100 | #173 | Average 5.3% |
| Immigrants | Iran | 50.0 /100 | #174 | Average 5.3% |
| Immigrants | Iraq | 48.1 /100 | #175 | Average 5.3% |
| Immigrants | Poland | 46.0 /100 | #176 | Average 5.3% |
| Immigrants | Peru | 44.6 /100 | #177 | Average 5.3% |
| Osage | 42.5 /100 | #178 | Average 5.3% |
| Immigrants | Oceania | 40.8 /100 | #179 | Average 5.3% |
| Malaysians | 39.6 /100 | #180 | Fair 5.3% |
| Immigrants | Afghanistan | 37.9 /100 | #181 | Fair 5.3% |
| Potawatomi | 37.8 /100 | #182 | Fair 5.3% |
| Taiwanese | 37.6 /100 | #183 | Fair 5.3% |
| Spaniards | 35.1 /100 | #184 | Fair 5.3% |
| Koreans | 34.9 /100 | #185 | Fair 5.3% |
| Iraqis | 31.6 /100 | #186 | Fair 5.4% |
| Costa Ricans | 31.3 /100 | #187 | Fair 5.4% |