Venezuelan vs Immigrants from Moldova Male Unemployment
COMPARE
Venezuelan
Immigrants from Moldova
Male Unemployment
Male Unemployment Comparison
Venezuelans
Immigrants from Moldova
4.5%
MALE UNEMPLOYMENT
100.0/ 100
METRIC RATING
6th/ 347
METRIC RANK
5.1%
MALE UNEMPLOYMENT
90.3/ 100
METRIC RATING
112th/ 347
METRIC RANK
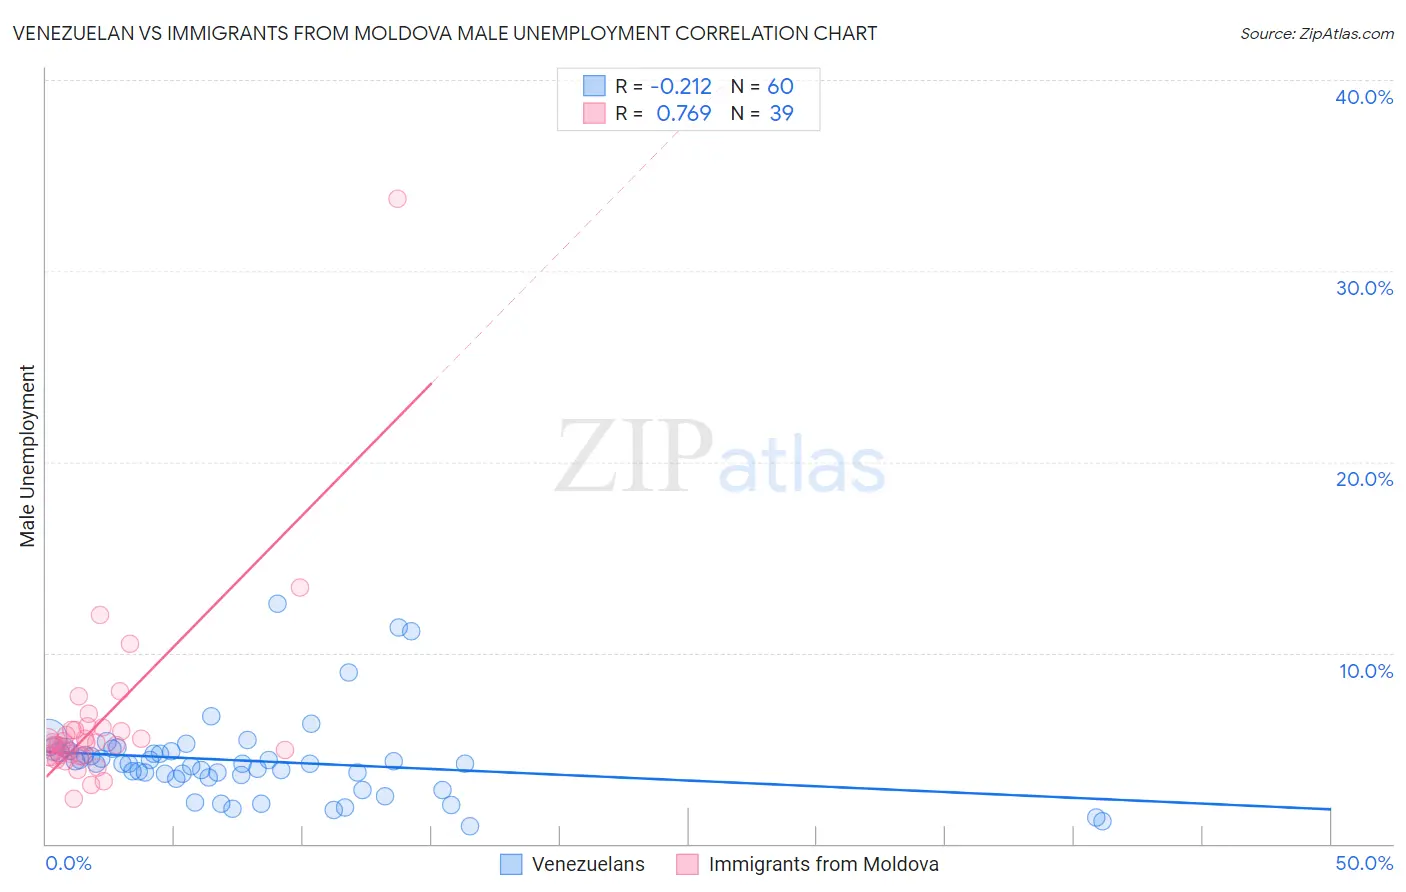
Venezuelan vs Immigrants from Moldova Male Unemployment Correlation Chart
The statistical analysis conducted on geographies consisting of 305,681,073 people shows a weak negative correlation between the proportion of Venezuelans and unemployment rate among males in the United States with a correlation coefficient (R) of -0.212 and weighted average of 4.5%. Similarly, the statistical analysis conducted on geographies consisting of 124,231,836 people shows a strong positive correlation between the proportion of Immigrants from Moldova and unemployment rate among males in the United States with a correlation coefficient (R) of 0.769 and weighted average of 5.1%, a difference of 13.4%.
Male Unemployment Correlation Summary
| Measurement | Venezuelan | Immigrants from Moldova |
| Minimum | 0.90% | 2.4% |
| Maximum | 12.6% | 33.8% |
| Range | 11.7% | 31.4% |
| Mean | 4.3% | 6.4% |
| Median | 4.2% | 5.3% |
| Interquartile 25% (IQ1) | 3.5% | 4.6% |
| Interquartile 75% (IQ3) | 4.8% | 6.0% |
| Interquartile Range (IQR) | 1.3% | 1.4% |
| Standard Deviation (Sample) | 2.2% | 5.0% |
| Standard Deviation (Population) | 2.2% | 4.9% |
Similar Demographics by Male Unemployment
Demographics Similar to Venezuelans by Male Unemployment
In terms of male unemployment, the demographic groups most similar to Venezuelans are Czech (4.5%, a difference of 0.20%), Danish (4.5%, a difference of 0.45%), Luxembourger (4.5%, a difference of 0.46%), Immigrants from Venezuela (4.4%, a difference of 1.5%), and Thai (4.6%, a difference of 1.7%).
| Demographics | Rating | Rank | Male Unemployment |
| Immigrants | India | 100.0 /100 | #1 | Exceptional 4.4% |
| Immigrants | Cuba | 100.0 /100 | #2 | Exceptional 4.4% |
| Norwegians | 100.0 /100 | #3 | Exceptional 4.4% |
| Immigrants | Venezuela | 100.0 /100 | #4 | Exceptional 4.4% |
| Danes | 100.0 /100 | #5 | Exceptional 4.5% |
| Venezuelans | 100.0 /100 | #6 | Exceptional 4.5% |
| Czechs | 100.0 /100 | #7 | Exceptional 4.5% |
| Luxembourgers | 100.0 /100 | #8 | Exceptional 4.5% |
| Thais | 100.0 /100 | #9 | Exceptional 4.6% |
| Cubans | 100.0 /100 | #10 | Exceptional 4.6% |
| Swedes | 100.0 /100 | #11 | Exceptional 4.6% |
| Immigrants | Bolivia | 100.0 /100 | #12 | Exceptional 4.7% |
| Bolivians | 100.0 /100 | #13 | Exceptional 4.7% |
| Germans | 100.0 /100 | #14 | Exceptional 4.7% |
| Scandinavians | 100.0 /100 | #15 | Exceptional 4.7% |
Demographics Similar to Immigrants from Moldova by Male Unemployment
In terms of male unemployment, the demographic groups most similar to Immigrants from Moldova are Immigrants from Austria (5.1%, a difference of 0.010%), Immigrants from Eastern Asia (5.1%, a difference of 0.080%), Romanian (5.1%, a difference of 0.080%), Immigrants from England (5.1%, a difference of 0.090%), and Immigrants from Pakistan (5.1%, a difference of 0.11%).
| Demographics | Rating | Rank | Male Unemployment |
| Immigrants | Czechoslovakia | 91.7 /100 | #105 | Exceptional 5.1% |
| Immigrants | Ethiopia | 91.5 /100 | #106 | Exceptional 5.1% |
| Ethiopians | 91.3 /100 | #107 | Exceptional 5.1% |
| Immigrants | Nicaragua | 91.2 /100 | #108 | Exceptional 5.1% |
| Immigrants | Pakistan | 90.9 /100 | #109 | Exceptional 5.1% |
| Immigrants | England | 90.8 /100 | #110 | Exceptional 5.1% |
| Immigrants | Eastern Asia | 90.8 /100 | #111 | Exceptional 5.1% |
| Immigrants | Moldova | 90.3 /100 | #112 | Exceptional 5.1% |
| Immigrants | Austria | 90.3 /100 | #113 | Exceptional 5.1% |
| Romanians | 89.8 /100 | #114 | Excellent 5.1% |
| Immigrants | Asia | 89.6 /100 | #115 | Excellent 5.1% |
| Immigrants | Denmark | 89.4 /100 | #116 | Excellent 5.1% |
| Estonians | 89.0 /100 | #117 | Excellent 5.1% |
| Cypriots | 88.8 /100 | #118 | Excellent 5.1% |
| French Canadians | 88.6 /100 | #119 | Excellent 5.1% |