Immigrants from Albania vs Haitian Unemployment Among Women with Children Under 6 years
COMPARE
Immigrants from Albania
Haitian
Unemployment Among Women with Children Under 6 years
Unemployment Among Women with Children Under 6 years Comparison
Immigrants from Albania
Haitians
7.1%
UNEMPLOYMENT AMONG WOMEN WITH CHILDREN UNDER 6 YEARS
98.7/ 100
METRIC RATING
84th/ 347
METRIC RANK
8.6%
UNEMPLOYMENT AMONG WOMEN WITH CHILDREN UNDER 6 YEARS
0.0/ 100
METRIC RATING
277th/ 347
METRIC RANK
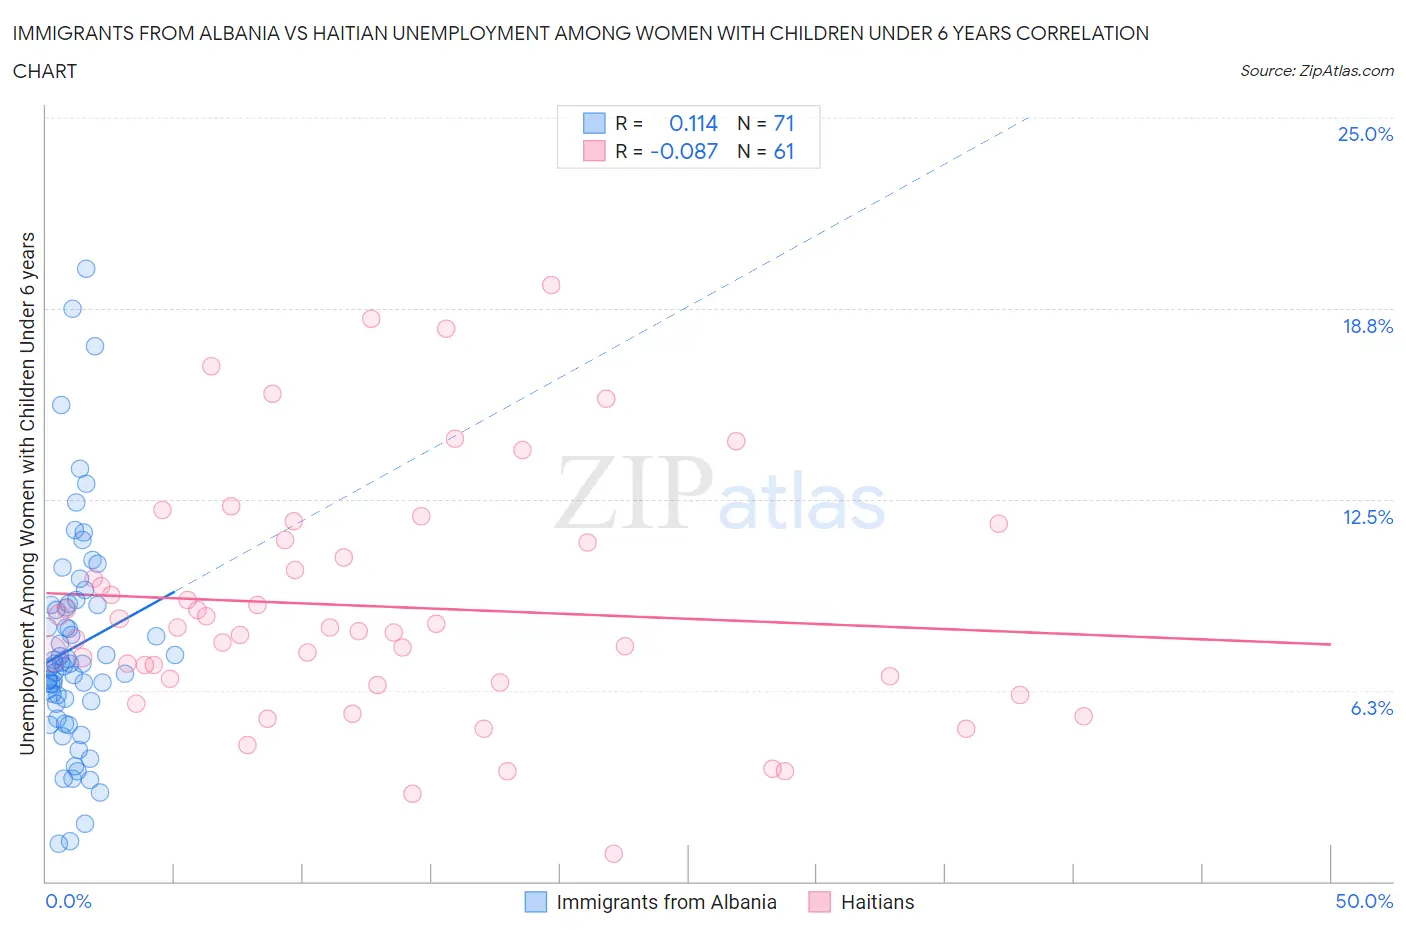
Immigrants from Albania vs Haitian Unemployment Among Women with Children Under 6 years Correlation Chart
The statistical analysis conducted on geographies consisting of 102,982,733 people shows a poor positive correlation between the proportion of Immigrants from Albania and unemployment rate among women with children under the age of 6 in the United States with a correlation coefficient (R) of 0.114 and weighted average of 7.1%. Similarly, the statistical analysis conducted on geographies consisting of 230,903,570 people shows a slight negative correlation between the proportion of Haitians and unemployment rate among women with children under the age of 6 in the United States with a correlation coefficient (R) of -0.087 and weighted average of 8.6%, a difference of 21.4%.
Unemployment Among Women with Children Under 6 years Correlation Summary
| Measurement | Immigrants from Albania | Haitian |
| Minimum | 1.2% | 0.90% |
| Maximum | 20.1% | 19.5% |
| Range | 18.8% | 18.6% |
| Mean | 7.7% | 9.0% |
| Median | 7.1% | 8.3% |
| Interquartile 25% (IQ1) | 5.8% | 6.6% |
| Interquartile 75% (IQ3) | 9.1% | 11.1% |
| Interquartile Range (IQR) | 3.2% | 4.6% |
| Standard Deviation (Sample) | 3.6% | 3.9% |
| Standard Deviation (Population) | 3.6% | 3.9% |
Similar Demographics by Unemployment Among Women with Children Under 6 years
Demographics Similar to Immigrants from Albania by Unemployment Among Women with Children Under 6 years
In terms of unemployment among women with children under 6 years, the demographic groups most similar to Immigrants from Albania are Immigrants from Romania (7.1%, a difference of 0.040%), Egyptian (7.1%, a difference of 0.050%), Immigrants from Afghanistan (7.1%, a difference of 0.080%), Immigrants from Zimbabwe (7.1%, a difference of 0.16%), and Immigrants from Venezuela (7.1%, a difference of 0.23%).
| Demographics | Rating | Rank | Unemployment Among Women with Children Under 6 years |
| Immigrants | Croatia | 98.9 /100 | #77 | Exceptional 7.1% |
| Immigrants | Somalia | 98.9 /100 | #78 | Exceptional 7.1% |
| Immigrants | Fiji | 98.9 /100 | #79 | Exceptional 7.1% |
| Immigrants | Greece | 98.9 /100 | #80 | Exceptional 7.1% |
| Immigrants | Venezuela | 98.8 /100 | #81 | Exceptional 7.1% |
| Immigrants | Afghanistan | 98.7 /100 | #82 | Exceptional 7.1% |
| Egyptians | 98.7 /100 | #83 | Exceptional 7.1% |
| Immigrants | Albania | 98.7 /100 | #84 | Exceptional 7.1% |
| Immigrants | Romania | 98.7 /100 | #85 | Exceptional 7.1% |
| Immigrants | Zimbabwe | 98.6 /100 | #86 | Exceptional 7.1% |
| Alsatians | 98.4 /100 | #87 | Exceptional 7.1% |
| Immigrants | Hungary | 98.3 /100 | #88 | Exceptional 7.1% |
| Immigrants | Denmark | 98.3 /100 | #89 | Exceptional 7.1% |
| Immigrants | Spain | 98.2 /100 | #90 | Exceptional 7.1% |
| Danes | 98.2 /100 | #91 | Exceptional 7.1% |
Demographics Similar to Haitians by Unemployment Among Women with Children Under 6 years
In terms of unemployment among women with children under 6 years, the demographic groups most similar to Haitians are Yaqui (8.6%, a difference of 0.10%), Immigrants from Dominica (8.6%, a difference of 0.28%), Immigrants from Guatemala (8.6%, a difference of 0.29%), Immigrants from Belize (8.6%, a difference of 0.33%), and Immigrants from Latin America (8.6%, a difference of 0.45%).
| Demographics | Rating | Rank | Unemployment Among Women with Children Under 6 years |
| Immigrants | Senegal | 0.2 /100 | #270 | Tragic 8.5% |
| Immigrants | Congo | 0.2 /100 | #271 | Tragic 8.5% |
| Mexican American Indians | 0.1 /100 | #272 | Tragic 8.5% |
| Slovaks | 0.1 /100 | #273 | Tragic 8.5% |
| Immigrants | Cameroon | 0.1 /100 | #274 | Tragic 8.6% |
| Immigrants | Latin America | 0.1 /100 | #275 | Tragic 8.6% |
| Yaqui | 0.0 /100 | #276 | Tragic 8.6% |
| Haitians | 0.0 /100 | #277 | Tragic 8.6% |
| Immigrants | Dominica | 0.0 /100 | #278 | Tragic 8.6% |
| Immigrants | Guatemala | 0.0 /100 | #279 | Tragic 8.6% |
| Immigrants | Belize | 0.0 /100 | #280 | Tragic 8.6% |
| Guatemalans | 0.0 /100 | #281 | Tragic 8.7% |
| Bermudans | 0.0 /100 | #282 | Tragic 8.7% |
| Spanish American Indians | 0.0 /100 | #283 | Tragic 8.7% |
| Blackfeet | 0.0 /100 | #284 | Tragic 8.7% |