Hispanic or Latino vs Ottawa Unemployment Among Women with Children Ages 6 to 17 years
COMPARE
Hispanic or Latino
Ottawa
Unemployment Among Women with Children Ages 6 to 17 years
Unemployment Among Women with Children Ages 6 to 17 years Comparison
Hispanics or Latinos
Ottawa
9.9%
UNEMPLOYMENT AMONG WOMEN WITH CHILDREN AGES 6 TO 17 YEARS
0.0/ 100
METRIC RATING
285th/ 347
METRIC RANK
10.9%
UNEMPLOYMENT AMONG WOMEN WITH CHILDREN AGES 6 TO 17 YEARS
0.0/ 100
METRIC RATING
328th/ 347
METRIC RANK
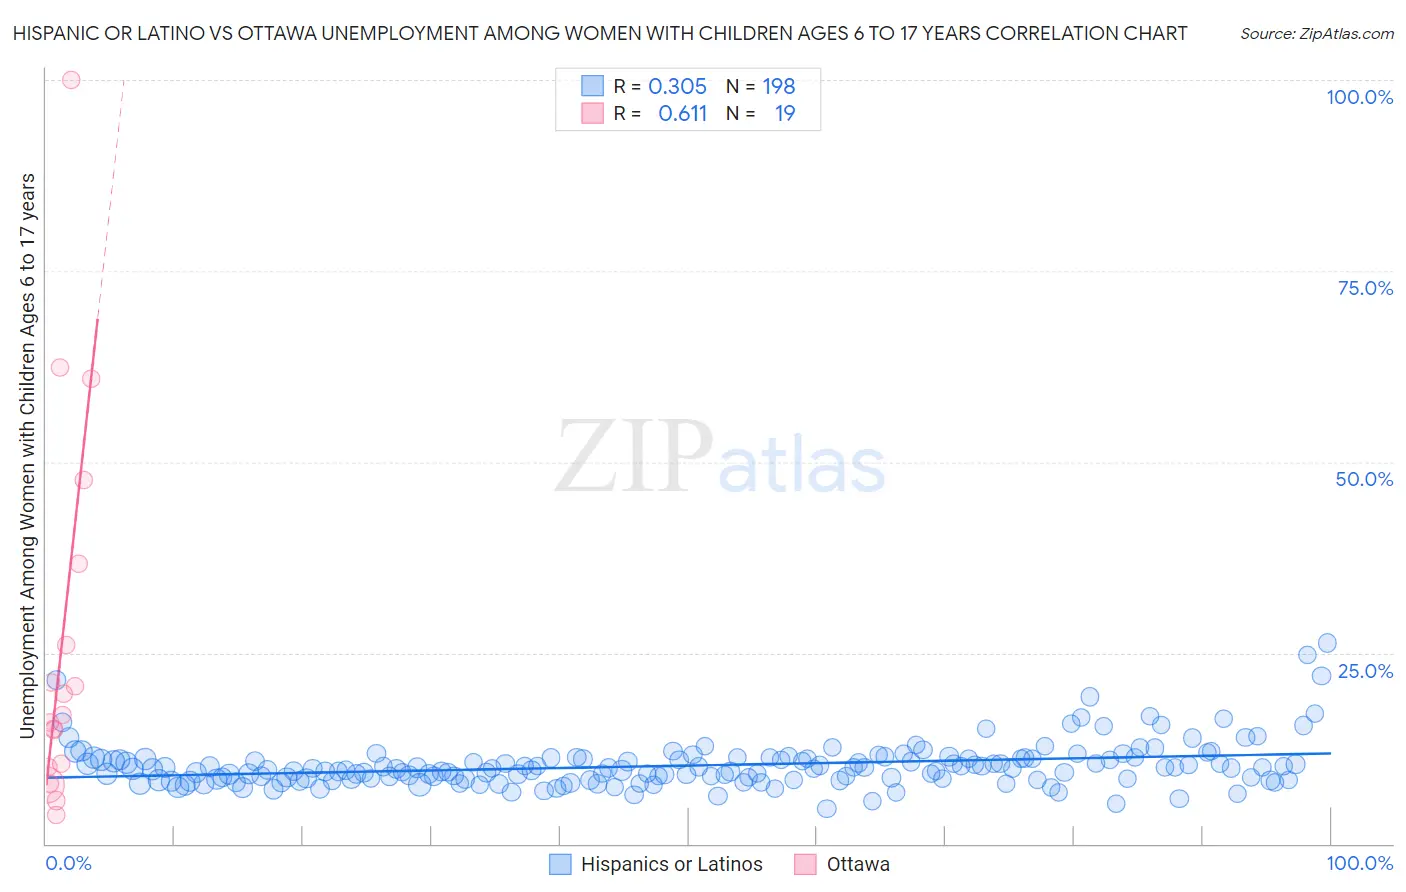
Hispanic or Latino vs Ottawa Unemployment Among Women with Children Ages 6 to 17 years Correlation Chart
The statistical analysis conducted on geographies consisting of 359,612,346 people shows a mild positive correlation between the proportion of Hispanics or Latinos and unemployment rate among women with children between the ages 6 and 17 in the United States with a correlation coefficient (R) of 0.305 and weighted average of 9.9%. Similarly, the statistical analysis conducted on geographies consisting of 42,886,423 people shows a significant positive correlation between the proportion of Ottawa and unemployment rate among women with children between the ages 6 and 17 in the United States with a correlation coefficient (R) of 0.611 and weighted average of 10.9%, a difference of 9.6%.
Unemployment Among Women with Children Ages 6 to 17 years Correlation Summary
| Measurement | Hispanic or Latino | Ottawa |
| Minimum | 4.6% | 3.7% |
| Maximum | 26.3% | 100.0% |
| Range | 21.7% | 96.3% |
| Mean | 10.2% | 26.5% |
| Median | 9.8% | 16.8% |
| Interquartile 25% (IQ1) | 8.4% | 10.0% |
| Interquartile 75% (IQ3) | 11.2% | 36.6% |
| Interquartile Range (IQR) | 2.7% | 26.6% |
| Standard Deviation (Sample) | 3.0% | 24.9% |
| Standard Deviation (Population) | 3.0% | 24.3% |
Similar Demographics by Unemployment Among Women with Children Ages 6 to 17 years
Demographics Similar to Hispanics or Latinos by Unemployment Among Women with Children Ages 6 to 17 years
In terms of unemployment among women with children ages 6 to 17 years, the demographic groups most similar to Hispanics or Latinos are Choctaw (9.9%, a difference of 0.12%), Sierra Leonean (9.9%, a difference of 0.16%), Yakama (9.9%, a difference of 0.31%), Shoshone (10.0%, a difference of 0.41%), and Central American Indian (9.9%, a difference of 0.46%).
| Demographics | Rating | Rank | Unemployment Among Women with Children Ages 6 to 17 years |
| French | 0.1 /100 | #278 | Tragic 9.7% |
| Scotch-Irish | 0.1 /100 | #279 | Tragic 9.7% |
| Seminole | 0.1 /100 | #280 | Tragic 9.7% |
| Jamaicans | 0.0 /100 | #281 | Tragic 9.8% |
| Slovaks | 0.0 /100 | #282 | Tragic 9.8% |
| Central American Indians | 0.0 /100 | #283 | Tragic 9.9% |
| Yakama | 0.0 /100 | #284 | Tragic 9.9% |
| Hispanics or Latinos | 0.0 /100 | #285 | Tragic 9.9% |
| Choctaw | 0.0 /100 | #286 | Tragic 9.9% |
| Sierra Leoneans | 0.0 /100 | #287 | Tragic 9.9% |
| Shoshone | 0.0 /100 | #288 | Tragic 10.0% |
| Hondurans | 0.0 /100 | #289 | Tragic 10.0% |
| Sub-Saharan Africans | 0.0 /100 | #290 | Tragic 10.0% |
| Immigrants | Nonimmigrants | 0.0 /100 | #291 | Tragic 10.0% |
| Carpatho Rusyns | 0.0 /100 | #292 | Tragic 10.0% |
Demographics Similar to Ottawa by Unemployment Among Women with Children Ages 6 to 17 years
In terms of unemployment among women with children ages 6 to 17 years, the demographic groups most similar to Ottawa are Cape Verdean (10.9%, a difference of 0.14%), Liberian (10.8%, a difference of 0.20%), Cajun (10.8%, a difference of 0.27%), Immigrants from Dominican Republic (10.8%, a difference of 0.46%), and Dominican (10.8%, a difference of 0.52%).
| Demographics | Rating | Rank | Unemployment Among Women with Children Ages 6 to 17 years |
| Tohono O'odham | 0.0 /100 | #321 | Tragic 10.7% |
| Cree | 0.0 /100 | #322 | Tragic 10.8% |
| Dominicans | 0.0 /100 | #323 | Tragic 10.8% |
| Immigrants | Dominican Republic | 0.0 /100 | #324 | Tragic 10.8% |
| Cajuns | 0.0 /100 | #325 | Tragic 10.8% |
| Liberians | 0.0 /100 | #326 | Tragic 10.8% |
| Cape Verdeans | 0.0 /100 | #327 | Tragic 10.9% |
| Ottawa | 0.0 /100 | #328 | Tragic 10.9% |
| Pennsylvania Germans | 0.0 /100 | #329 | Tragic 11.0% |
| Chippewa | 0.0 /100 | #330 | Tragic 11.1% |
| Blacks/African Americans | 0.0 /100 | #331 | Tragic 11.4% |
| Tsimshian | 0.0 /100 | #332 | Tragic 11.4% |
| Natives/Alaskans | 0.0 /100 | #333 | Tragic 11.5% |
| Ugandans | 0.0 /100 | #334 | Tragic 12.0% |
| Colville | 0.0 /100 | #335 | Tragic 12.3% |