Hispanic or Latino vs Immigrants from West Indies Unemployment Among Women with Children Ages 6 to 17 years
COMPARE
Hispanic or Latino
Immigrants from West Indies
Unemployment Among Women with Children Ages 6 to 17 years
Unemployment Among Women with Children Ages 6 to 17 years Comparison
Hispanics or Latinos
Immigrants from West Indies
9.9%
UNEMPLOYMENT AMONG WOMEN WITH CHILDREN AGES 6 TO 17 YEARS
0.0/ 100
METRIC RATING
285th/ 347
METRIC RANK
9.0%
UNEMPLOYMENT AMONG WOMEN WITH CHILDREN AGES 6 TO 17 YEARS
52.2/ 100
METRIC RATING
172nd/ 347
METRIC RANK
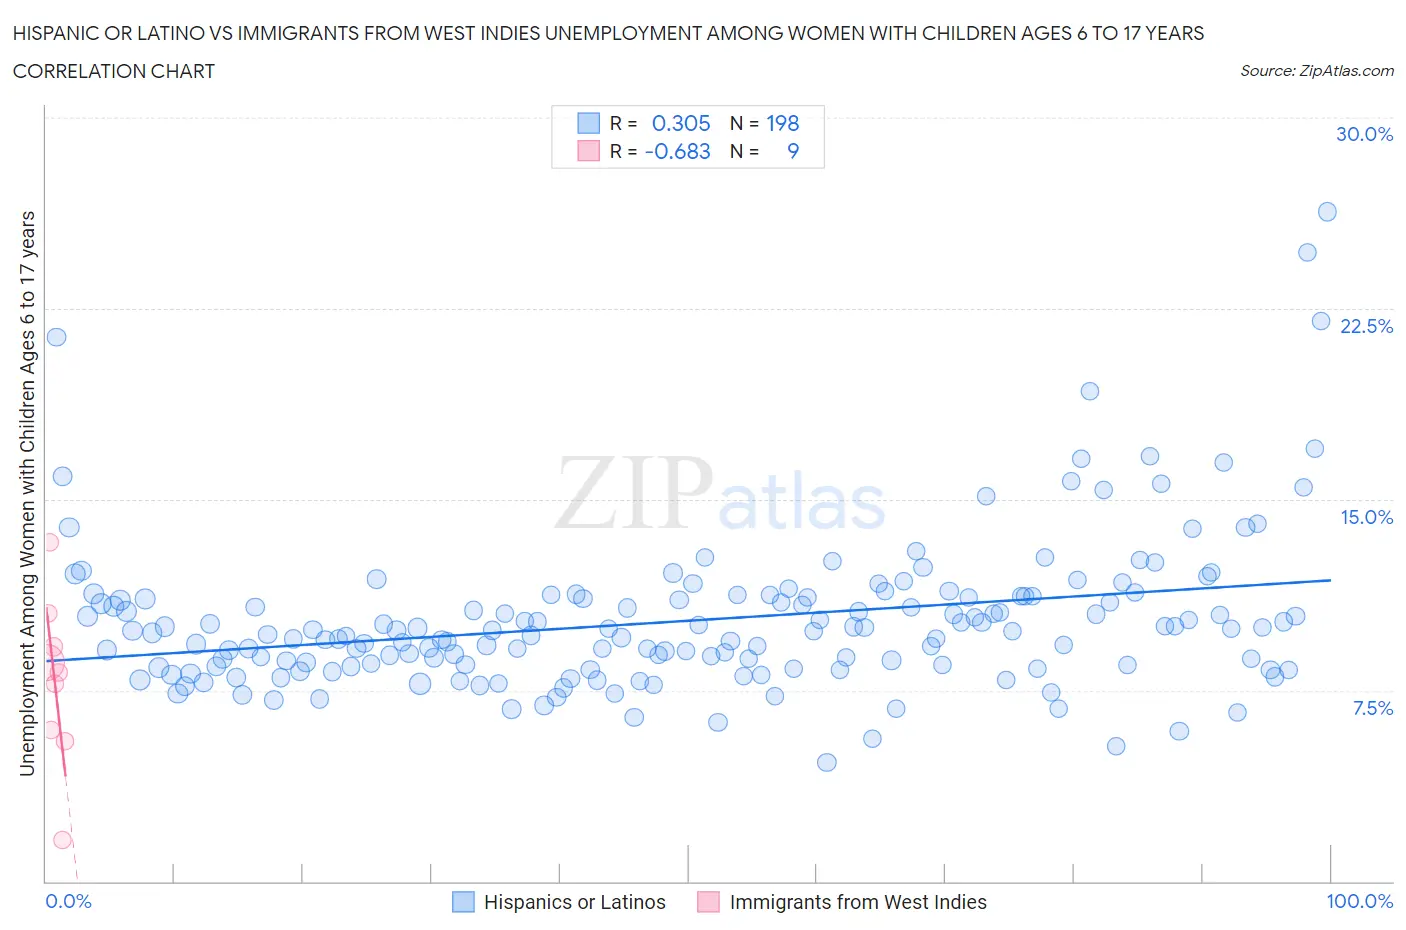
Hispanic or Latino vs Immigrants from West Indies Unemployment Among Women with Children Ages 6 to 17 years Correlation Chart
The statistical analysis conducted on geographies consisting of 359,612,346 people shows a mild positive correlation between the proportion of Hispanics or Latinos and unemployment rate among women with children between the ages 6 and 17 in the United States with a correlation coefficient (R) of 0.305 and weighted average of 9.9%. Similarly, the statistical analysis conducted on geographies consisting of 64,988,134 people shows a significant negative correlation between the proportion of Immigrants from West Indies and unemployment rate among women with children between the ages 6 and 17 in the United States with a correlation coefficient (R) of -0.683 and weighted average of 9.0%, a difference of 10.8%.
Unemployment Among Women with Children Ages 6 to 17 years Correlation Summary
| Measurement | Hispanic or Latino | Immigrants from West Indies |
| Minimum | 4.6% | 1.6% |
| Maximum | 26.3% | 13.3% |
| Range | 21.7% | 11.7% |
| Mean | 10.2% | 7.8% |
| Median | 9.8% | 8.2% |
| Interquartile 25% (IQ1) | 8.4% | 5.7% |
| Interquartile 75% (IQ3) | 11.2% | 9.9% |
| Interquartile Range (IQR) | 2.7% | 4.1% |
| Standard Deviation (Sample) | 3.0% | 3.3% |
| Standard Deviation (Population) | 3.0% | 3.1% |
Similar Demographics by Unemployment Among Women with Children Ages 6 to 17 years
Demographics Similar to Hispanics or Latinos by Unemployment Among Women with Children Ages 6 to 17 years
In terms of unemployment among women with children ages 6 to 17 years, the demographic groups most similar to Hispanics or Latinos are Choctaw (9.9%, a difference of 0.12%), Sierra Leonean (9.9%, a difference of 0.16%), Yakama (9.9%, a difference of 0.31%), Shoshone (10.0%, a difference of 0.41%), and Central American Indian (9.9%, a difference of 0.46%).
| Demographics | Rating | Rank | Unemployment Among Women with Children Ages 6 to 17 years |
| French | 0.1 /100 | #278 | Tragic 9.7% |
| Scotch-Irish | 0.1 /100 | #279 | Tragic 9.7% |
| Seminole | 0.1 /100 | #280 | Tragic 9.7% |
| Jamaicans | 0.0 /100 | #281 | Tragic 9.8% |
| Slovaks | 0.0 /100 | #282 | Tragic 9.8% |
| Central American Indians | 0.0 /100 | #283 | Tragic 9.9% |
| Yakama | 0.0 /100 | #284 | Tragic 9.9% |
| Hispanics or Latinos | 0.0 /100 | #285 | Tragic 9.9% |
| Choctaw | 0.0 /100 | #286 | Tragic 9.9% |
| Sierra Leoneans | 0.0 /100 | #287 | Tragic 9.9% |
| Shoshone | 0.0 /100 | #288 | Tragic 10.0% |
| Hondurans | 0.0 /100 | #289 | Tragic 10.0% |
| Sub-Saharan Africans | 0.0 /100 | #290 | Tragic 10.0% |
| Immigrants | Nonimmigrants | 0.0 /100 | #291 | Tragic 10.0% |
| Carpatho Rusyns | 0.0 /100 | #292 | Tragic 10.0% |
Demographics Similar to Immigrants from West Indies by Unemployment Among Women with Children Ages 6 to 17 years
In terms of unemployment among women with children ages 6 to 17 years, the demographic groups most similar to Immigrants from West Indies are Jordanian (9.0%, a difference of 0.0%), Immigrants from Brazil (9.0%, a difference of 0.050%), Turkish (8.9%, a difference of 0.090%), Immigrants from Costa Rica (9.0%, a difference of 0.10%), and British (8.9%, a difference of 0.14%).
| Demographics | Rating | Rank | Unemployment Among Women with Children Ages 6 to 17 years |
| Immigrants | Micronesia | 59.2 /100 | #165 | Average 8.9% |
| Moroccans | 58.3 /100 | #166 | Average 8.9% |
| Immigrants | England | 57.7 /100 | #167 | Average 8.9% |
| Immigrants | Croatia | 57.1 /100 | #168 | Average 8.9% |
| British | 55.2 /100 | #169 | Average 8.9% |
| Turks | 54.1 /100 | #170 | Average 8.9% |
| Jordanians | 52.2 /100 | #171 | Average 9.0% |
| Immigrants | West Indies | 52.2 /100 | #172 | Average 9.0% |
| Immigrants | Brazil | 51.0 /100 | #173 | Average 9.0% |
| Immigrants | Costa Rica | 50.0 /100 | #174 | Average 9.0% |
| Immigrants | Sierra Leone | 45.9 /100 | #175 | Average 9.0% |
| Immigrants | Italy | 43.7 /100 | #176 | Average 9.0% |
| Immigrants | Jordan | 41.6 /100 | #177 | Average 9.0% |
| Menominee | 39.3 /100 | #178 | Fair 9.0% |
| Immigrants | Zaire | 38.3 /100 | #179 | Fair 9.0% |