Immigrants from Saudi Arabia vs Immigrants from West Indies Unemployment Among Women with Children Ages 6 to 17 years
COMPARE
Immigrants from Saudi Arabia
Immigrants from West Indies
Unemployment Among Women with Children Ages 6 to 17 years
Unemployment Among Women with Children Ages 6 to 17 years Comparison
Immigrants from Saudi Arabia
Immigrants from West Indies
9.3%
UNEMPLOYMENT AMONG WOMEN WITH CHILDREN AGES 6 TO 17 YEARS
2.7/ 100
METRIC RATING
239th/ 347
METRIC RANK
9.0%
UNEMPLOYMENT AMONG WOMEN WITH CHILDREN AGES 6 TO 17 YEARS
52.2/ 100
METRIC RATING
172nd/ 347
METRIC RANK
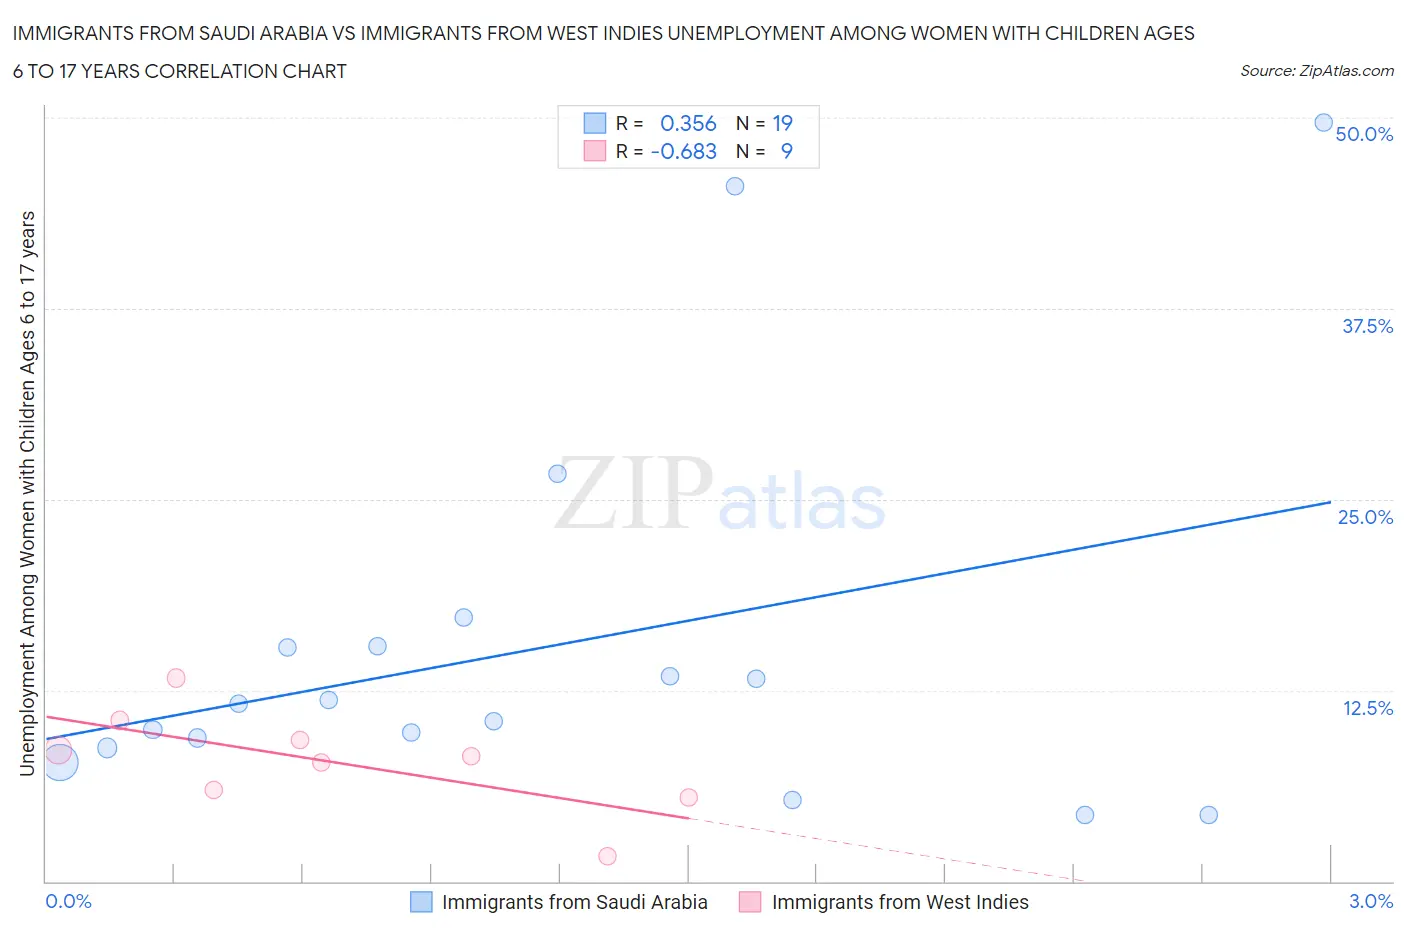
Immigrants from Saudi Arabia vs Immigrants from West Indies Unemployment Among Women with Children Ages 6 to 17 years Correlation Chart
The statistical analysis conducted on geographies consisting of 135,443,902 people shows a mild positive correlation between the proportion of Immigrants from Saudi Arabia and unemployment rate among women with children between the ages 6 and 17 in the United States with a correlation coefficient (R) of 0.356 and weighted average of 9.3%. Similarly, the statistical analysis conducted on geographies consisting of 64,988,134 people shows a significant negative correlation between the proportion of Immigrants from West Indies and unemployment rate among women with children between the ages 6 and 17 in the United States with a correlation coefficient (R) of -0.683 and weighted average of 9.0%, a difference of 4.1%.
Unemployment Among Women with Children Ages 6 to 17 years Correlation Summary
| Measurement | Immigrants from Saudi Arabia | Immigrants from West Indies |
| Minimum | 4.3% | 1.6% |
| Maximum | 49.7% | 13.3% |
| Range | 45.4% | 11.7% |
| Mean | 15.3% | 7.8% |
| Median | 11.6% | 8.2% |
| Interquartile 25% (IQ1) | 8.7% | 5.7% |
| Interquartile 75% (IQ3) | 15.4% | 9.9% |
| Interquartile Range (IQR) | 6.7% | 4.1% |
| Standard Deviation (Sample) | 12.5% | 3.3% |
| Standard Deviation (Population) | 12.2% | 3.1% |
Similar Demographics by Unemployment Among Women with Children Ages 6 to 17 years
Demographics Similar to Immigrants from Saudi Arabia by Unemployment Among Women with Children Ages 6 to 17 years
In terms of unemployment among women with children ages 6 to 17 years, the demographic groups most similar to Immigrants from Saudi Arabia are Arab (9.3%, a difference of 0.0%), Immigrants from Belize (9.3%, a difference of 0.080%), Hungarian (9.3%, a difference of 0.13%), Guatemalan (9.3%, a difference of 0.14%), and Uruguayan (9.3%, a difference of 0.15%).
| Demographics | Rating | Rank | Unemployment Among Women with Children Ages 6 to 17 years |
| French American Indians | 3.7 /100 | #232 | Tragic 9.3% |
| Immigrants | St. Vincent and the Grenadines | 3.3 /100 | #233 | Tragic 9.3% |
| Mexicans | 3.2 /100 | #234 | Tragic 9.3% |
| Uruguayans | 3.0 /100 | #235 | Tragic 9.3% |
| Hungarians | 3.0 /100 | #236 | Tragic 9.3% |
| Immigrants | Belize | 2.8 /100 | #237 | Tragic 9.3% |
| Arabs | 2.7 /100 | #238 | Tragic 9.3% |
| Immigrants | Saudi Arabia | 2.7 /100 | #239 | Tragic 9.3% |
| Guatemalans | 2.3 /100 | #240 | Tragic 9.3% |
| Colombians | 2.2 /100 | #241 | Tragic 9.3% |
| Immigrants | Colombia | 2.1 /100 | #242 | Tragic 9.3% |
| Scottish | 2.0 /100 | #243 | Tragic 9.4% |
| English | 1.9 /100 | #244 | Tragic 9.4% |
| Immigrants | Cameroon | 1.8 /100 | #245 | Tragic 9.4% |
| Immigrants | Africa | 1.6 /100 | #246 | Tragic 9.4% |
Demographics Similar to Immigrants from West Indies by Unemployment Among Women with Children Ages 6 to 17 years
In terms of unemployment among women with children ages 6 to 17 years, the demographic groups most similar to Immigrants from West Indies are Jordanian (9.0%, a difference of 0.0%), Immigrants from Brazil (9.0%, a difference of 0.050%), Turkish (8.9%, a difference of 0.090%), Immigrants from Costa Rica (9.0%, a difference of 0.10%), and British (8.9%, a difference of 0.14%).
| Demographics | Rating | Rank | Unemployment Among Women with Children Ages 6 to 17 years |
| Immigrants | Micronesia | 59.2 /100 | #165 | Average 8.9% |
| Moroccans | 58.3 /100 | #166 | Average 8.9% |
| Immigrants | England | 57.7 /100 | #167 | Average 8.9% |
| Immigrants | Croatia | 57.1 /100 | #168 | Average 8.9% |
| British | 55.2 /100 | #169 | Average 8.9% |
| Turks | 54.1 /100 | #170 | Average 8.9% |
| Jordanians | 52.2 /100 | #171 | Average 9.0% |
| Immigrants | West Indies | 52.2 /100 | #172 | Average 9.0% |
| Immigrants | Brazil | 51.0 /100 | #173 | Average 9.0% |
| Immigrants | Costa Rica | 50.0 /100 | #174 | Average 9.0% |
| Immigrants | Sierra Leone | 45.9 /100 | #175 | Average 9.0% |
| Immigrants | Italy | 43.7 /100 | #176 | Average 9.0% |
| Immigrants | Jordan | 41.6 /100 | #177 | Average 9.0% |
| Menominee | 39.3 /100 | #178 | Fair 9.0% |
| Immigrants | Zaire | 38.3 /100 | #179 | Fair 9.0% |