Hispanic or Latino vs Chickasaw Unemployment Among Ages 30 to 34 years
COMPARE
Hispanic or Latino
Chickasaw
Unemployment Among Ages 30 to 34 years
Unemployment Among Ages 30 to 34 years Comparison
Hispanics or Latinos
Chickasaw
6.4%
UNEMPLOYMENT AMONG AGES 30 TO 34 YEARS
0.0/ 100
METRIC RATING
283rd/ 347
METRIC RANK
6.2%
UNEMPLOYMENT AMONG AGES 30 TO 34 YEARS
0.0/ 100
METRIC RATING
264th/ 347
METRIC RANK
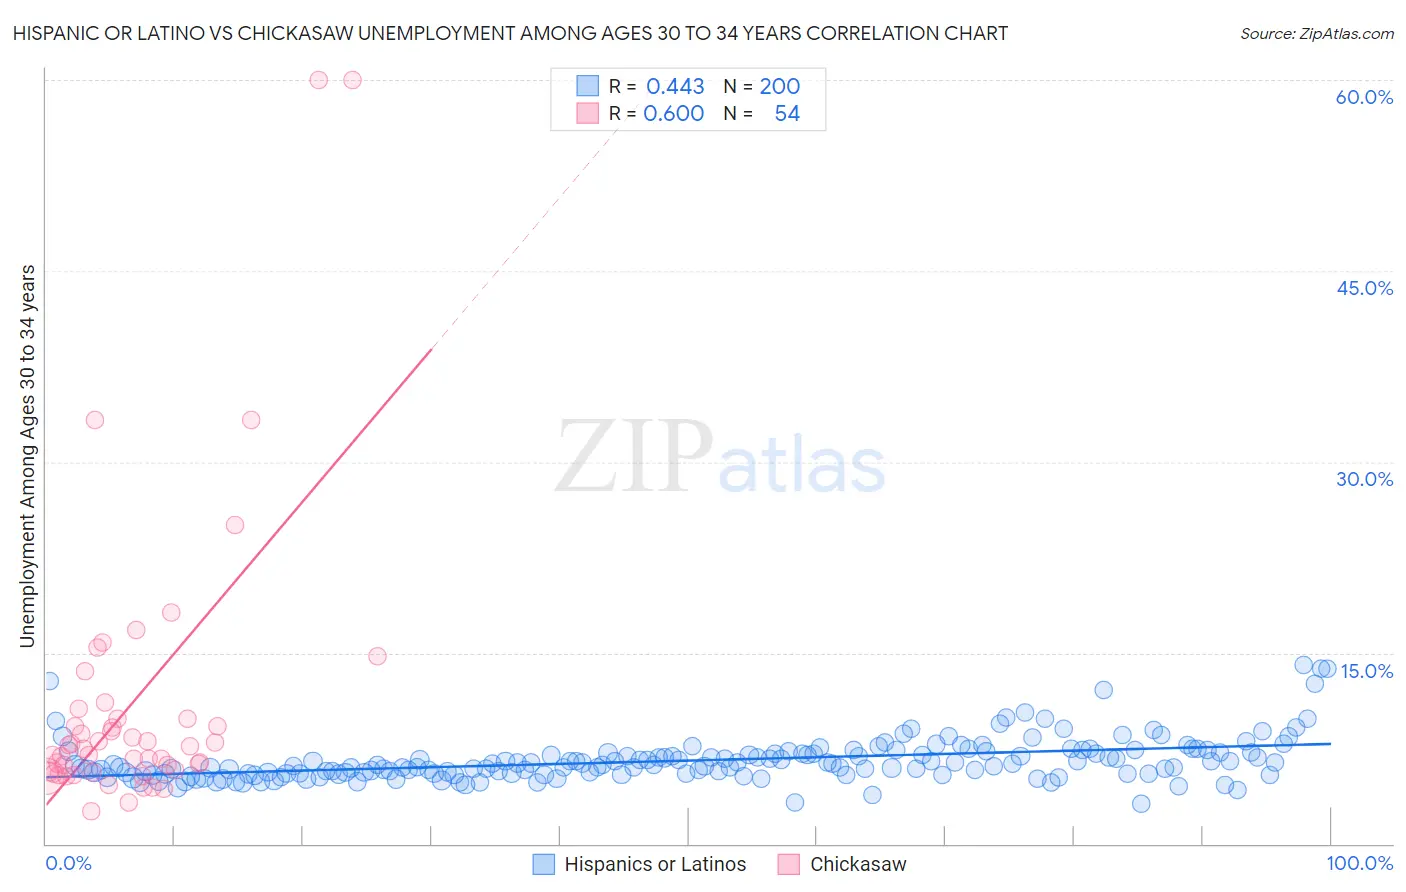
Hispanic or Latino vs Chickasaw Unemployment Among Ages 30 to 34 years Correlation Chart
The statistical analysis conducted on geographies consisting of 503,591,851 people shows a moderate positive correlation between the proportion of Hispanics or Latinos and unemployment rate among population between the ages 30 and 34 in the United States with a correlation coefficient (R) of 0.443 and weighted average of 6.4%. Similarly, the statistical analysis conducted on geographies consisting of 143,279,410 people shows a significant positive correlation between the proportion of Chickasaw and unemployment rate among population between the ages 30 and 34 in the United States with a correlation coefficient (R) of 0.600 and weighted average of 6.2%, a difference of 3.5%.
Unemployment Among Ages 30 to 34 years Correlation Summary
| Measurement | Hispanic or Latino | Chickasaw |
| Minimum | 3.2% | 2.6% |
| Maximum | 14.1% | 60.0% |
| Range | 10.9% | 57.4% |
| Mean | 6.5% | 11.1% |
| Median | 6.1% | 7.6% |
| Interquartile 25% (IQ1) | 5.5% | 5.7% |
| Interquartile 75% (IQ3) | 7.1% | 9.8% |
| Interquartile Range (IQR) | 1.6% | 4.2% |
| Standard Deviation (Sample) | 1.7% | 11.5% |
| Standard Deviation (Population) | 1.7% | 11.4% |
Demographics Similar to Hispanics or Latinos and Chickasaw by Unemployment Among Ages 30 to 34 years
In terms of unemployment among ages 30 to 34 years, the demographic groups most similar to Hispanics or Latinos are African (6.4%, a difference of 0.030%), Immigrants from Caribbean (6.4%, a difference of 0.40%), Cherokee (6.4%, a difference of 0.73%), Cree (6.4%, a difference of 0.77%), and Osage (6.3%, a difference of 1.3%). Similarly, the demographic groups most similar to Chickasaw are Spanish American (6.2%, a difference of 0.050%), American (6.2%, a difference of 0.11%), Seminole (6.2%, a difference of 0.20%), Immigrants from Mexico (6.2%, a difference of 0.40%), and Immigrants from Haiti (6.2%, a difference of 0.56%).
| Demographics | Rating | Rank | Unemployment Among Ages 30 to 34 years |
| Spanish Americans | 0.0 /100 | #263 | Tragic 6.2% |
| Chickasaw | 0.0 /100 | #264 | Tragic 6.2% |
| Americans | 0.0 /100 | #265 | Tragic 6.2% |
| Seminole | 0.0 /100 | #266 | Tragic 6.2% |
| Immigrants | Mexico | 0.0 /100 | #267 | Tragic 6.2% |
| Immigrants | Haiti | 0.0 /100 | #268 | Tragic 6.2% |
| French American Indians | 0.0 /100 | #269 | Tragic 6.3% |
| Immigrants | Senegal | 0.0 /100 | #270 | Tragic 6.3% |
| Comanche | 0.0 /100 | #271 | Tragic 6.3% |
| Blackfeet | 0.0 /100 | #272 | Tragic 6.3% |
| Ottawa | 0.0 /100 | #273 | Tragic 6.3% |
| U.S. Virgin Islanders | 0.0 /100 | #274 | Tragic 6.3% |
| Ecuadorians | 0.0 /100 | #275 | Tragic 6.3% |
| Pennsylvania Germans | 0.0 /100 | #276 | Tragic 6.3% |
| Immigrants | Ecuador | 0.0 /100 | #277 | Tragic 6.3% |
| Osage | 0.0 /100 | #278 | Tragic 6.3% |
| Cree | 0.0 /100 | #279 | Tragic 6.4% |
| Cherokee | 0.0 /100 | #280 | Tragic 6.4% |
| Immigrants | Caribbean | 0.0 /100 | #281 | Tragic 6.4% |
| Africans | 0.0 /100 | #282 | Tragic 6.4% |
| Hispanics or Latinos | 0.0 /100 | #283 | Tragic 6.4% |