Hispanic or Latino vs Black/African American Unemployment Among Ages 30 to 34 years
COMPARE
Hispanic or Latino
Black/African American
Unemployment Among Ages 30 to 34 years
Unemployment Among Ages 30 to 34 years Comparison
Hispanics or Latinos
Blacks/African Americans
6.4%
UNEMPLOYMENT AMONG AGES 30 TO 34 YEARS
0.0/ 100
METRIC RATING
283rd/ 347
METRIC RANK
7.2%
UNEMPLOYMENT AMONG AGES 30 TO 34 YEARS
0.0/ 100
METRIC RATING
318th/ 347
METRIC RANK
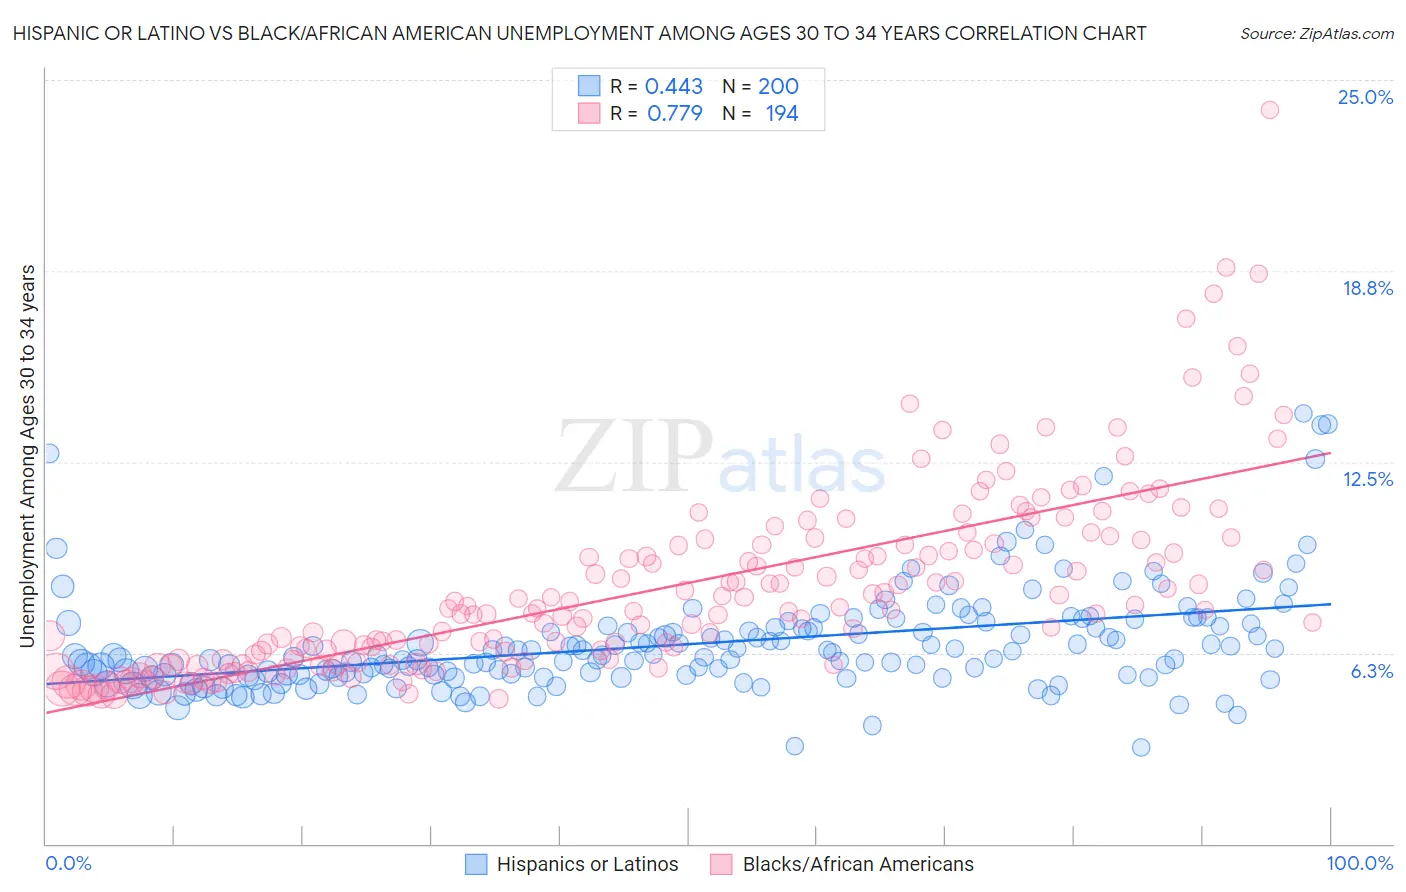
Hispanic or Latino vs Black/African American Unemployment Among Ages 30 to 34 years Correlation Chart
The statistical analysis conducted on geographies consisting of 503,591,851 people shows a moderate positive correlation between the proportion of Hispanics or Latinos and unemployment rate among population between the ages 30 and 34 in the United States with a correlation coefficient (R) of 0.443 and weighted average of 6.4%. Similarly, the statistical analysis conducted on geographies consisting of 499,385,483 people shows a strong positive correlation between the proportion of Blacks/African Americans and unemployment rate among population between the ages 30 and 34 in the United States with a correlation coefficient (R) of 0.779 and weighted average of 7.2%, a difference of 11.9%.
Unemployment Among Ages 30 to 34 years Correlation Summary
| Measurement | Hispanic or Latino | Black/African American |
| Minimum | 3.2% | 4.7% |
| Maximum | 14.1% | 24.0% |
| Range | 10.9% | 19.3% |
| Mean | 6.5% | 8.4% |
| Median | 6.1% | 7.7% |
| Interquartile 25% (IQ1) | 5.5% | 6.0% |
| Interquartile 75% (IQ3) | 7.1% | 9.8% |
| Interquartile Range (IQR) | 1.6% | 3.8% |
| Standard Deviation (Sample) | 1.7% | 3.1% |
| Standard Deviation (Population) | 1.7% | 3.1% |
Similar Demographics by Unemployment Among Ages 30 to 34 years
Demographics Similar to Hispanics or Latinos by Unemployment Among Ages 30 to 34 years
In terms of unemployment among ages 30 to 34 years, the demographic groups most similar to Hispanics or Latinos are African (6.4%, a difference of 0.030%), Immigrants from Bangladesh (6.4%, a difference of 0.060%), Choctaw (6.4%, a difference of 0.17%), Central American Indian (6.4%, a difference of 0.21%), and Immigrants from West Indies (6.4%, a difference of 0.23%).
| Demographics | Rating | Rank | Unemployment Among Ages 30 to 34 years |
| Pennsylvania Germans | 0.0 /100 | #276 | Tragic 6.3% |
| Immigrants | Ecuador | 0.0 /100 | #277 | Tragic 6.3% |
| Osage | 0.0 /100 | #278 | Tragic 6.3% |
| Cree | 0.0 /100 | #279 | Tragic 6.4% |
| Cherokee | 0.0 /100 | #280 | Tragic 6.4% |
| Immigrants | Caribbean | 0.0 /100 | #281 | Tragic 6.4% |
| Africans | 0.0 /100 | #282 | Tragic 6.4% |
| Hispanics or Latinos | 0.0 /100 | #283 | Tragic 6.4% |
| Immigrants | Bangladesh | 0.0 /100 | #284 | Tragic 6.4% |
| Choctaw | 0.0 /100 | #285 | Tragic 6.4% |
| Central American Indians | 0.0 /100 | #286 | Tragic 6.4% |
| Immigrants | West Indies | 0.0 /100 | #287 | Tragic 6.4% |
| Senegalese | 0.0 /100 | #288 | Tragic 6.4% |
| Menominee | 0.0 /100 | #289 | Tragic 6.4% |
| Immigrants | Trinidad and Tobago | 0.0 /100 | #290 | Tragic 6.5% |
Demographics Similar to Blacks/African Americans by Unemployment Among Ages 30 to 34 years
In terms of unemployment among ages 30 to 34 years, the demographic groups most similar to Blacks/African Americans are Guyanese (7.2%, a difference of 0.060%), Cape Verdean (7.2%, a difference of 0.090%), Immigrants from Cabo Verde (7.2%, a difference of 0.10%), Houma (7.2%, a difference of 0.37%), and Immigrants from Guyana (7.2%, a difference of 0.38%).
| Demographics | Rating | Rank | Unemployment Among Ages 30 to 34 years |
| Alaskan Athabascans | 0.0 /100 | #311 | Tragic 7.0% |
| British West Indians | 0.0 /100 | #312 | Tragic 7.0% |
| Ute | 0.0 /100 | #313 | Tragic 7.0% |
| Lumbee | 0.0 /100 | #314 | Tragic 7.1% |
| Aleuts | 0.0 /100 | #315 | Tragic 7.1% |
| Houma | 0.0 /100 | #316 | Tragic 7.2% |
| Immigrants | Cabo Verde | 0.0 /100 | #317 | Tragic 7.2% |
| Blacks/African Americans | 0.0 /100 | #318 | Tragic 7.2% |
| Guyanese | 0.0 /100 | #319 | Tragic 7.2% |
| Cape Verdeans | 0.0 /100 | #320 | Tragic 7.2% |
| Immigrants | Guyana | 0.0 /100 | #321 | Tragic 7.2% |
| Marshallese | 0.0 /100 | #322 | Tragic 7.2% |
| Immigrants | Yemen | 0.0 /100 | #323 | Tragic 7.3% |
| Immigrants | Dominica | 0.0 /100 | #324 | Tragic 7.3% |
| Apache | 0.0 /100 | #325 | Tragic 7.3% |