Hispanic or Latino vs Danish Unemployment Among Ages 30 to 34 years
COMPARE
Hispanic or Latino
Danish
Unemployment Among Ages 30 to 34 years
Unemployment Among Ages 30 to 34 years Comparison
Hispanics or Latinos
Danes
6.4%
UNEMPLOYMENT AMONG AGES 30 TO 34 YEARS
0.0/ 100
METRIC RATING
283rd/ 347
METRIC RANK
5.0%
UNEMPLOYMENT AMONG AGES 30 TO 34 YEARS
99.5/ 100
METRIC RATING
27th/ 347
METRIC RANK
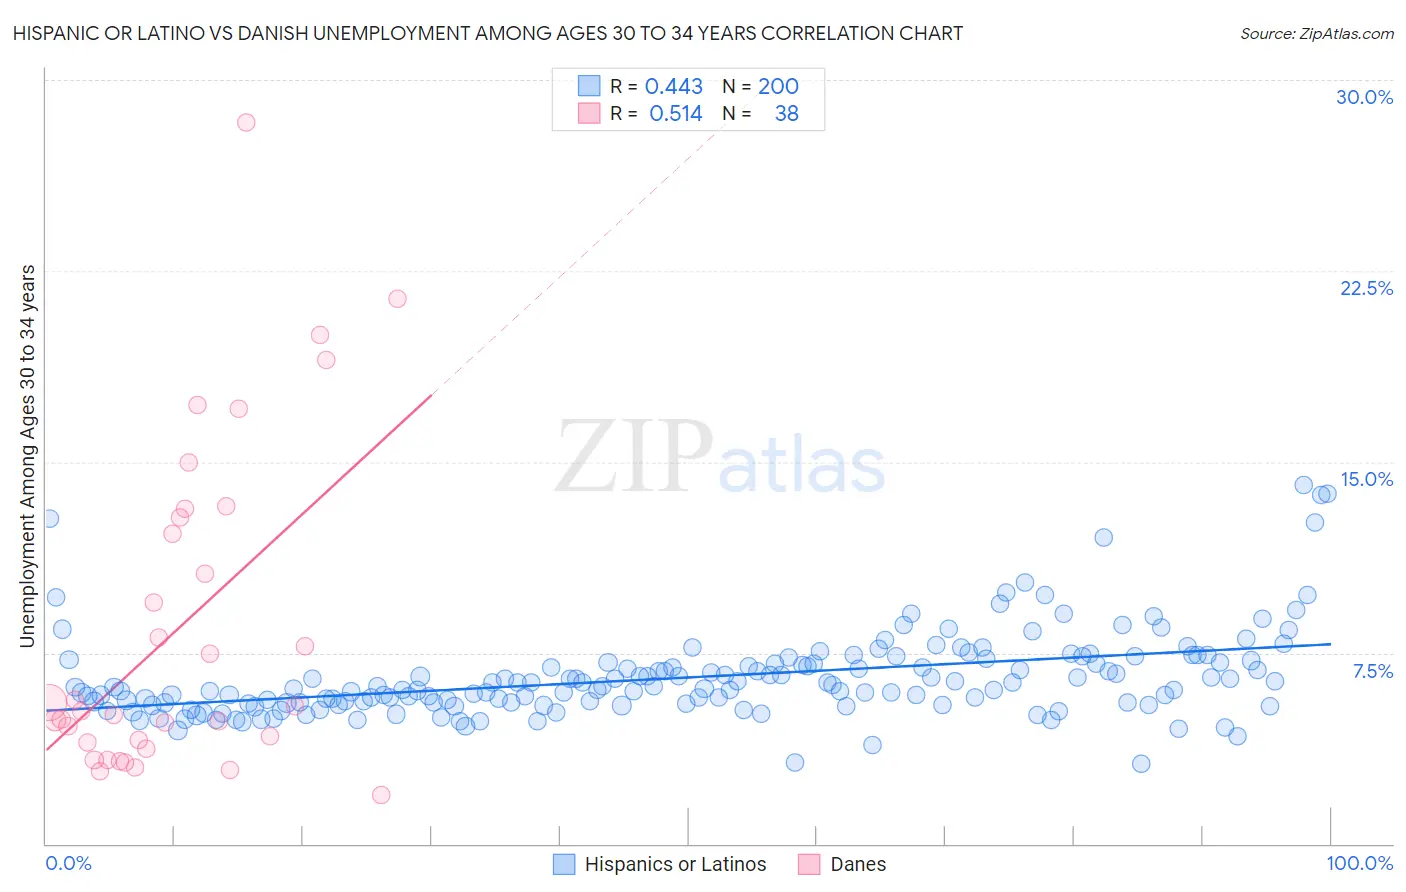
Hispanic or Latino vs Danish Unemployment Among Ages 30 to 34 years Correlation Chart
The statistical analysis conducted on geographies consisting of 503,591,851 people shows a moderate positive correlation between the proportion of Hispanics or Latinos and unemployment rate among population between the ages 30 and 34 in the United States with a correlation coefficient (R) of 0.443 and weighted average of 6.4%. Similarly, the statistical analysis conducted on geographies consisting of 429,862,227 people shows a substantial positive correlation between the proportion of Danes and unemployment rate among population between the ages 30 and 34 in the United States with a correlation coefficient (R) of 0.514 and weighted average of 5.0%, a difference of 29.2%.
Unemployment Among Ages 30 to 34 years Correlation Summary
| Measurement | Hispanic or Latino | Danish |
| Minimum | 3.2% | 1.9% |
| Maximum | 14.1% | 28.3% |
| Range | 10.9% | 26.4% |
| Mean | 6.5% | 8.5% |
| Median | 6.1% | 5.3% |
| Interquartile 25% (IQ1) | 5.5% | 4.0% |
| Interquartile 75% (IQ3) | 7.1% | 12.8% |
| Interquartile Range (IQR) | 1.6% | 8.8% |
| Standard Deviation (Sample) | 1.7% | 6.4% |
| Standard Deviation (Population) | 1.7% | 6.3% |
Similar Demographics by Unemployment Among Ages 30 to 34 years
Demographics Similar to Hispanics or Latinos by Unemployment Among Ages 30 to 34 years
In terms of unemployment among ages 30 to 34 years, the demographic groups most similar to Hispanics or Latinos are African (6.4%, a difference of 0.030%), Immigrants from Bangladesh (6.4%, a difference of 0.060%), Choctaw (6.4%, a difference of 0.17%), Central American Indian (6.4%, a difference of 0.21%), and Immigrants from West Indies (6.4%, a difference of 0.23%).
| Demographics | Rating | Rank | Unemployment Among Ages 30 to 34 years |
| Pennsylvania Germans | 0.0 /100 | #276 | Tragic 6.3% |
| Immigrants | Ecuador | 0.0 /100 | #277 | Tragic 6.3% |
| Osage | 0.0 /100 | #278 | Tragic 6.3% |
| Cree | 0.0 /100 | #279 | Tragic 6.4% |
| Cherokee | 0.0 /100 | #280 | Tragic 6.4% |
| Immigrants | Caribbean | 0.0 /100 | #281 | Tragic 6.4% |
| Africans | 0.0 /100 | #282 | Tragic 6.4% |
| Hispanics or Latinos | 0.0 /100 | #283 | Tragic 6.4% |
| Immigrants | Bangladesh | 0.0 /100 | #284 | Tragic 6.4% |
| Choctaw | 0.0 /100 | #285 | Tragic 6.4% |
| Central American Indians | 0.0 /100 | #286 | Tragic 6.4% |
| Immigrants | West Indies | 0.0 /100 | #287 | Tragic 6.4% |
| Senegalese | 0.0 /100 | #288 | Tragic 6.4% |
| Menominee | 0.0 /100 | #289 | Tragic 6.4% |
| Immigrants | Trinidad and Tobago | 0.0 /100 | #290 | Tragic 6.5% |
Demographics Similar to Danes by Unemployment Among Ages 30 to 34 years
In terms of unemployment among ages 30 to 34 years, the demographic groups most similar to Danes are Immigrants from Kuwait (5.0%, a difference of 0.11%), Immigrants from Cuba (5.0%, a difference of 0.24%), German Russian (5.0%, a difference of 0.26%), Immigrants from Singapore (5.0%, a difference of 0.27%), and Norwegian (5.0%, a difference of 0.28%).
| Demographics | Rating | Rank | Unemployment Among Ages 30 to 34 years |
| Immigrants | Taiwan | 99.8 /100 | #20 | Exceptional 4.9% |
| Ethiopians | 99.8 /100 | #21 | Exceptional 4.9% |
| Immigrants | South Central Asia | 99.8 /100 | #22 | Exceptional 4.9% |
| Hmong | 99.8 /100 | #23 | Exceptional 4.9% |
| Ugandans | 99.7 /100 | #24 | Exceptional 4.9% |
| Immigrants | Singapore | 99.5 /100 | #25 | Exceptional 5.0% |
| Immigrants | Kuwait | 99.5 /100 | #26 | Exceptional 5.0% |
| Danes | 99.5 /100 | #27 | Exceptional 5.0% |
| Immigrants | Cuba | 99.4 /100 | #28 | Exceptional 5.0% |
| German Russians | 99.4 /100 | #29 | Exceptional 5.0% |
| Norwegians | 99.4 /100 | #30 | Exceptional 5.0% |
| Somalis | 99.3 /100 | #31 | Exceptional 5.0% |
| Immigrants | Zaire | 99.3 /100 | #32 | Exceptional 5.0% |
| Immigrants | Saudi Arabia | 99.3 /100 | #33 | Exceptional 5.0% |
| Latvians | 99.3 /100 | #34 | Exceptional 5.0% |