Hawaiian vs Immigrants from Zaire Male Unemployment
COMPARE
Hawaiian
Immigrants from Zaire
Male Unemployment
Male Unemployment Comparison
Hawaiians
Immigrants from Zaire
5.7%
MALE UNEMPLOYMENT
0.6/ 100
METRIC RATING
247th/ 347
METRIC RANK
5.4%
MALE UNEMPLOYMENT
13.7/ 100
METRIC RATING
200th/ 347
METRIC RANK
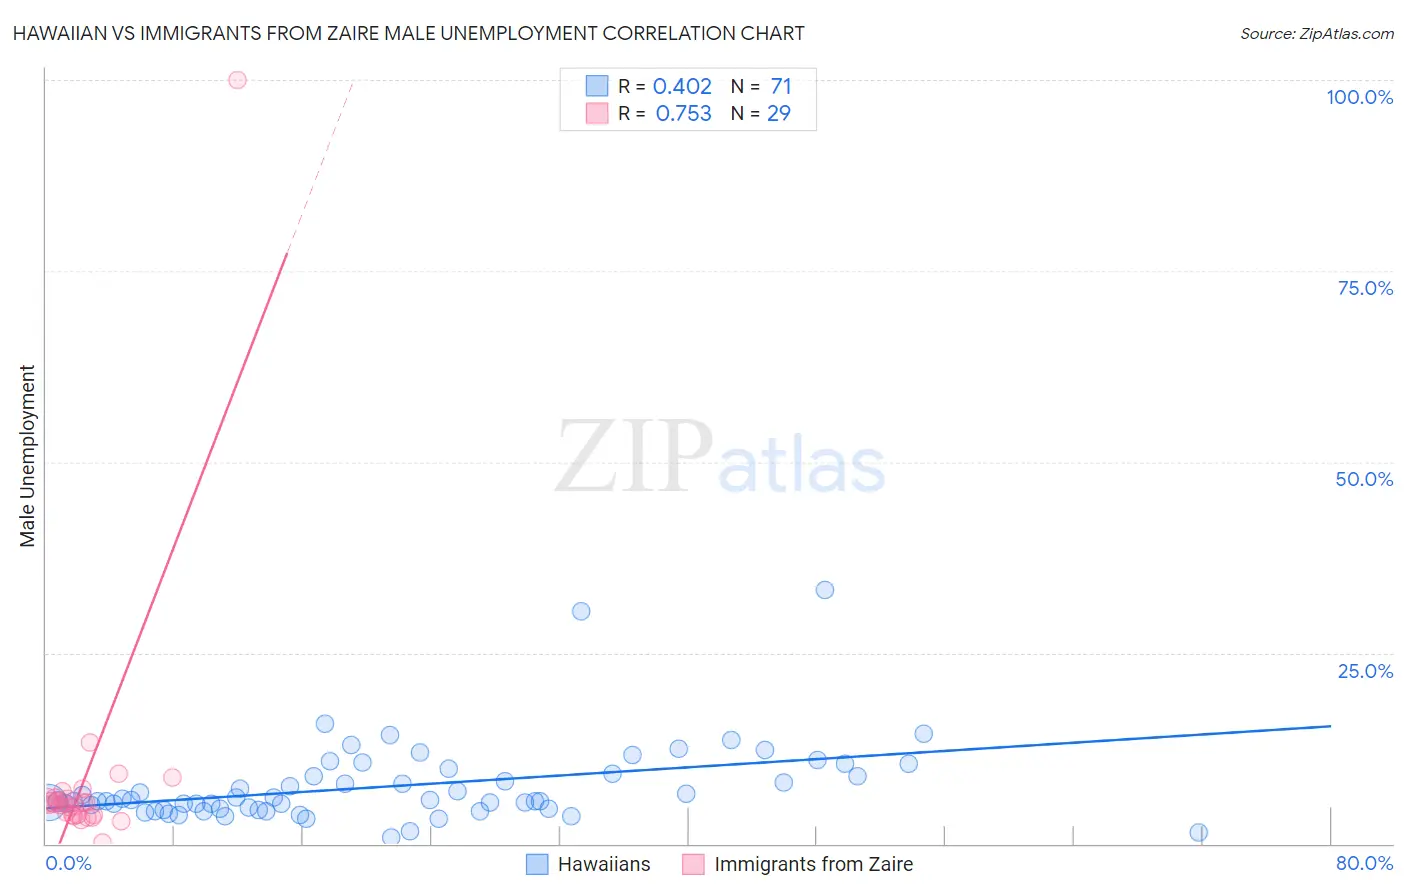
Hawaiian vs Immigrants from Zaire Male Unemployment Correlation Chart
The statistical analysis conducted on geographies consisting of 326,392,537 people shows a moderate positive correlation between the proportion of Hawaiians and unemployment rate among males in the United States with a correlation coefficient (R) of 0.402 and weighted average of 5.7%. Similarly, the statistical analysis conducted on geographies consisting of 107,173,070 people shows a strong positive correlation between the proportion of Immigrants from Zaire and unemployment rate among males in the United States with a correlation coefficient (R) of 0.753 and weighted average of 5.4%, a difference of 4.7%.
Male Unemployment Correlation Summary
| Measurement | Hawaiian | Immigrants from Zaire |
| Minimum | 0.80% | 0.20% |
| Maximum | 33.3% | 100.0% |
| Range | 32.5% | 99.8% |
| Mean | 7.5% | 8.5% |
| Median | 5.6% | 5.3% |
| Interquartile 25% (IQ1) | 4.6% | 3.7% |
| Interquartile 75% (IQ3) | 9.2% | 6.0% |
| Interquartile Range (IQR) | 4.6% | 2.3% |
| Standard Deviation (Sample) | 5.3% | 17.7% |
| Standard Deviation (Population) | 5.3% | 17.4% |
Similar Demographics by Male Unemployment
Demographics Similar to Hawaiians by Male Unemployment
In terms of male unemployment, the demographic groups most similar to Hawaiians are Iroquois (5.7%, a difference of 0.10%), Yaqui (5.7%, a difference of 0.19%), Marshallese (5.7%, a difference of 0.32%), Immigrants from El Salvador (5.7%, a difference of 0.35%), and Cree (5.7%, a difference of 0.39%).
| Demographics | Rating | Rank | Male Unemployment |
| Immigrants | Cameroon | 1.0 /100 | #240 | Tragic 5.6% |
| Salvadorans | 1.0 /100 | #241 | Tragic 5.7% |
| Ottawa | 0.9 /100 | #242 | Tragic 5.7% |
| Bangladeshis | 0.8 /100 | #243 | Tragic 5.7% |
| Immigrants | El Salvador | 0.7 /100 | #244 | Tragic 5.7% |
| Yaqui | 0.7 /100 | #245 | Tragic 5.7% |
| Iroquois | 0.6 /100 | #246 | Tragic 5.7% |
| Hawaiians | 0.6 /100 | #247 | Tragic 5.7% |
| Marshallese | 0.5 /100 | #248 | Tragic 5.7% |
| Cree | 0.4 /100 | #249 | Tragic 5.7% |
| Immigrants | Bahamas | 0.4 /100 | #250 | Tragic 5.7% |
| Spanish Americans | 0.3 /100 | #251 | Tragic 5.7% |
| Mexicans | 0.2 /100 | #252 | Tragic 5.8% |
| Mexican American Indians | 0.2 /100 | #253 | Tragic 5.8% |
| Japanese | 0.2 /100 | #254 | Tragic 5.8% |
Demographics Similar to Immigrants from Zaire by Male Unemployment
In terms of male unemployment, the demographic groups most similar to Immigrants from Zaire are Immigrants from Philippines (5.4%, a difference of 0.020%), Nonimmigrants (5.4%, a difference of 0.070%), Immigrants from Laos (5.4%, a difference of 0.080%), Immigrants from Greece (5.4%, a difference of 0.10%), and Immigrants from Thailand (5.4%, a difference of 0.12%).
| Demographics | Rating | Rank | Male Unemployment |
| Immigrants | Israel | 25.2 /100 | #193 | Fair 5.4% |
| Spanish | 19.7 /100 | #194 | Poor 5.4% |
| Immigrants | Southern Europe | 17.7 /100 | #195 | Poor 5.4% |
| Albanians | 17.3 /100 | #196 | Poor 5.4% |
| Alsatians | 16.7 /100 | #197 | Poor 5.4% |
| Immigrants | Thailand | 14.7 /100 | #198 | Poor 5.4% |
| Immigrants | Greece | 14.5 /100 | #199 | Poor 5.4% |
| Immigrants | Zaire | 13.7 /100 | #200 | Poor 5.4% |
| Immigrants | Philippines | 13.5 /100 | #201 | Poor 5.4% |
| Immigrants | Nonimmigrants | 13.1 /100 | #202 | Poor 5.4% |
| Immigrants | Laos | 13.0 /100 | #203 | Poor 5.4% |
| Guamanians/Chamorros | 12.3 /100 | #204 | Poor 5.4% |
| Immigrants | Costa Rica | 11.4 /100 | #205 | Poor 5.5% |
| Immigrants | Ukraine | 9.9 /100 | #206 | Tragic 5.5% |
| Immigrants | Syria | 9.3 /100 | #207 | Tragic 5.5% |