Haitian vs Immigrants from Northern Europe Female Unemployment
COMPARE
Haitian
Immigrants from Northern Europe
Female Unemployment
Female Unemployment Comparison
Haitians
Immigrants from Northern Europe
6.1%
FEMALE UNEMPLOYMENT
0.0/ 100
METRIC RATING
288th/ 347
METRIC RANK
4.9%
FEMALE UNEMPLOYMENT
98.0/ 100
METRIC RATING
72nd/ 347
METRIC RANK
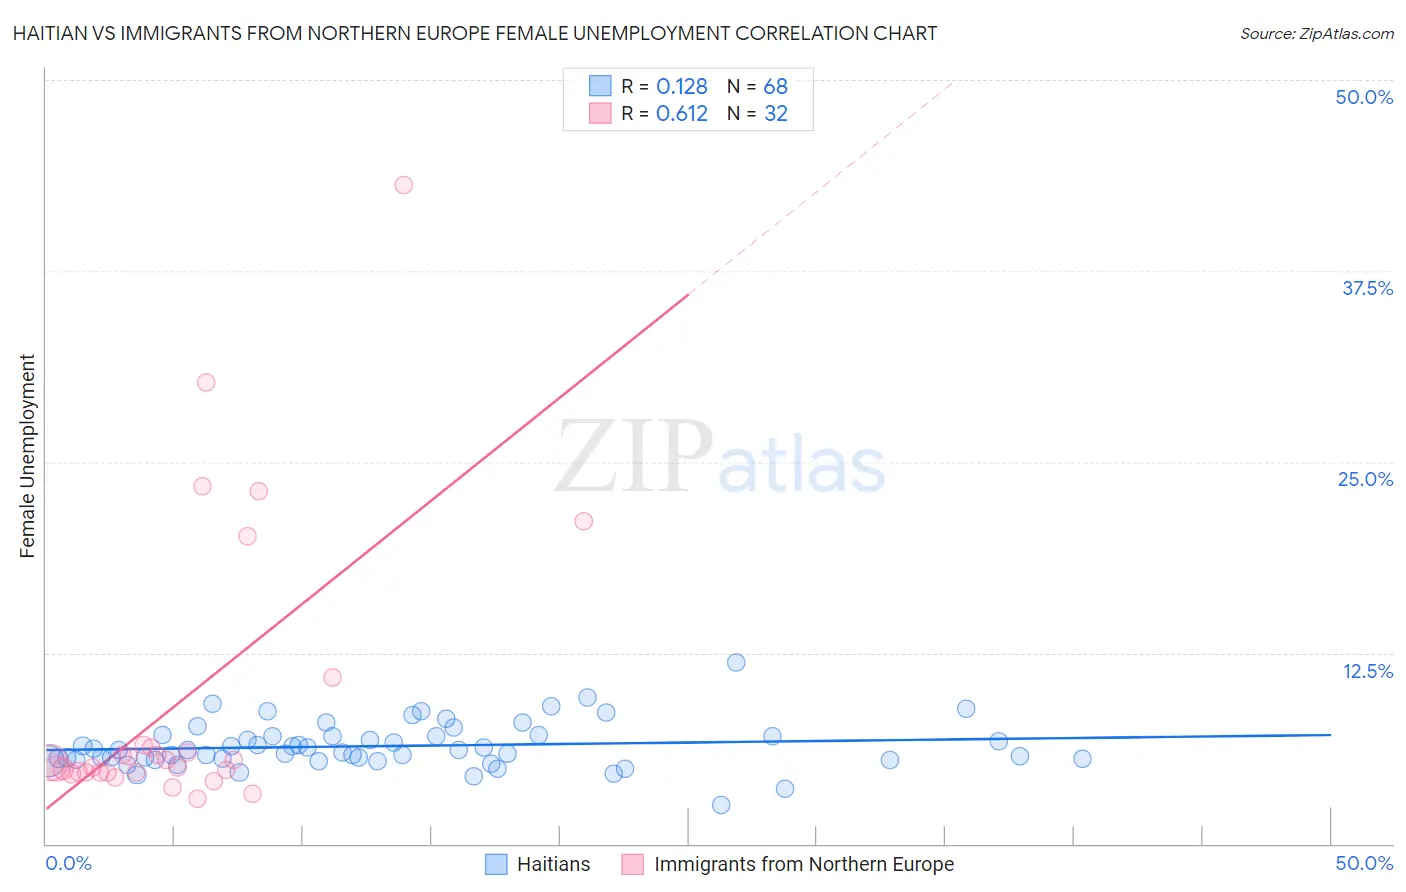
Haitian vs Immigrants from Northern Europe Female Unemployment Correlation Chart
The statistical analysis conducted on geographies consisting of 287,205,640 people shows a poor positive correlation between the proportion of Haitians and unemploymnet rate among females in the United States with a correlation coefficient (R) of 0.128 and weighted average of 6.1%. Similarly, the statistical analysis conducted on geographies consisting of 473,051,812 people shows a significant positive correlation between the proportion of Immigrants from Northern Europe and unemploymnet rate among females in the United States with a correlation coefficient (R) of 0.612 and weighted average of 4.9%, a difference of 23.0%.
Female Unemployment Correlation Summary
| Measurement | Haitian | Immigrants from Northern Europe |
| Minimum | 2.5% | 3.0% |
| Maximum | 11.9% | 43.1% |
| Range | 9.4% | 40.1% |
| Mean | 6.4% | 9.2% |
| Median | 6.1% | 5.1% |
| Interquartile 25% (IQ1) | 5.5% | 4.7% |
| Interquartile 75% (IQ3) | 7.1% | 6.4% |
| Interquartile Range (IQR) | 1.5% | 1.7% |
| Standard Deviation (Sample) | 1.5% | 9.4% |
| Standard Deviation (Population) | 1.5% | 9.2% |
Similar Demographics by Female Unemployment
Demographics Similar to Haitians by Female Unemployment
In terms of female unemployment, the demographic groups most similar to Haitians are Trinidadian and Tobagonian (6.1%, a difference of 0.010%), Immigrants from Guatemala (6.1%, a difference of 0.040%), Chippewa (6.1%, a difference of 0.070%), Immigrants from Caribbean (6.1%, a difference of 0.070%), and Immigrants from Cabo Verde (6.1%, a difference of 0.10%).
| Demographics | Rating | Rank | Female Unemployment |
| Guatemalans | 0.0 /100 | #281 | Tragic 6.0% |
| Colville | 0.0 /100 | #282 | Tragic 6.0% |
| Salvadorans | 0.0 /100 | #283 | Tragic 6.0% |
| Immigrants | Senegal | 0.0 /100 | #284 | Tragic 6.1% |
| Immigrants | Cabo Verde | 0.0 /100 | #285 | Tragic 6.1% |
| Chippewa | 0.0 /100 | #286 | Tragic 6.1% |
| Immigrants | Guatemala | 0.0 /100 | #287 | Tragic 6.1% |
| Haitians | 0.0 /100 | #288 | Tragic 6.1% |
| Trinidadians and Tobagonians | 0.0 /100 | #289 | Tragic 6.1% |
| Immigrants | Caribbean | 0.0 /100 | #290 | Tragic 6.1% |
| Immigrants | West Indies | 0.0 /100 | #291 | Tragic 6.1% |
| Immigrants | Trinidad and Tobago | 0.0 /100 | #292 | Tragic 6.1% |
| Mexicans | 0.0 /100 | #293 | Tragic 6.1% |
| Immigrants | El Salvador | 0.0 /100 | #294 | Tragic 6.1% |
| Immigrants | Latin America | 0.0 /100 | #295 | Tragic 6.1% |
Demographics Similar to Immigrants from Northern Europe by Female Unemployment
In terms of female unemployment, the demographic groups most similar to Immigrants from Northern Europe are Russian (5.0%, a difference of 0.030%), Immigrants from Bolivia (5.0%, a difference of 0.040%), Immigrants from Singapore (5.0%, a difference of 0.060%), German Russian (4.9%, a difference of 0.070%), and Immigrants from Venezuela (5.0%, a difference of 0.070%).
| Demographics | Rating | Rank | Female Unemployment |
| Immigrants | North America | 98.3 /100 | #65 | Exceptional 4.9% |
| Hungarians | 98.3 /100 | #66 | Exceptional 4.9% |
| Cubans | 98.3 /100 | #67 | Exceptional 4.9% |
| Tlingit-Haida | 98.3 /100 | #68 | Exceptional 4.9% |
| Immigrants | Ireland | 98.2 /100 | #69 | Exceptional 4.9% |
| Osage | 98.2 /100 | #70 | Exceptional 4.9% |
| German Russians | 98.1 /100 | #71 | Exceptional 4.9% |
| Immigrants | Northern Europe | 98.0 /100 | #72 | Exceptional 4.9% |
| Russians | 98.0 /100 | #73 | Exceptional 5.0% |
| Immigrants | Bolivia | 98.0 /100 | #74 | Exceptional 5.0% |
| Immigrants | Singapore | 98.0 /100 | #75 | Exceptional 5.0% |
| Immigrants | Venezuela | 97.9 /100 | #76 | Exceptional 5.0% |
| Mongolians | 97.8 /100 | #77 | Exceptional 5.0% |
| Immigrants | Netherlands | 97.8 /100 | #78 | Exceptional 5.0% |
| Turks | 97.6 /100 | #79 | Exceptional 5.0% |