Guyanese vs Immigrants from Lithuania Unemployment Among Ages 55 to 59 years
COMPARE
Guyanese
Immigrants from Lithuania
Unemployment Among Ages 55 to 59 years
Unemployment Among Ages 55 to 59 years Comparison
Guyanese
Immigrants from Lithuania
5.7%
UNEMPLOYMENT AMONG AGES 55 TO 59 YEARS
0.0/ 100
METRIC RATING
315th/ 347
METRIC RANK
4.8%
UNEMPLOYMENT AMONG AGES 55 TO 59 YEARS
70.8/ 100
METRIC RATING
149th/ 347
METRIC RANK
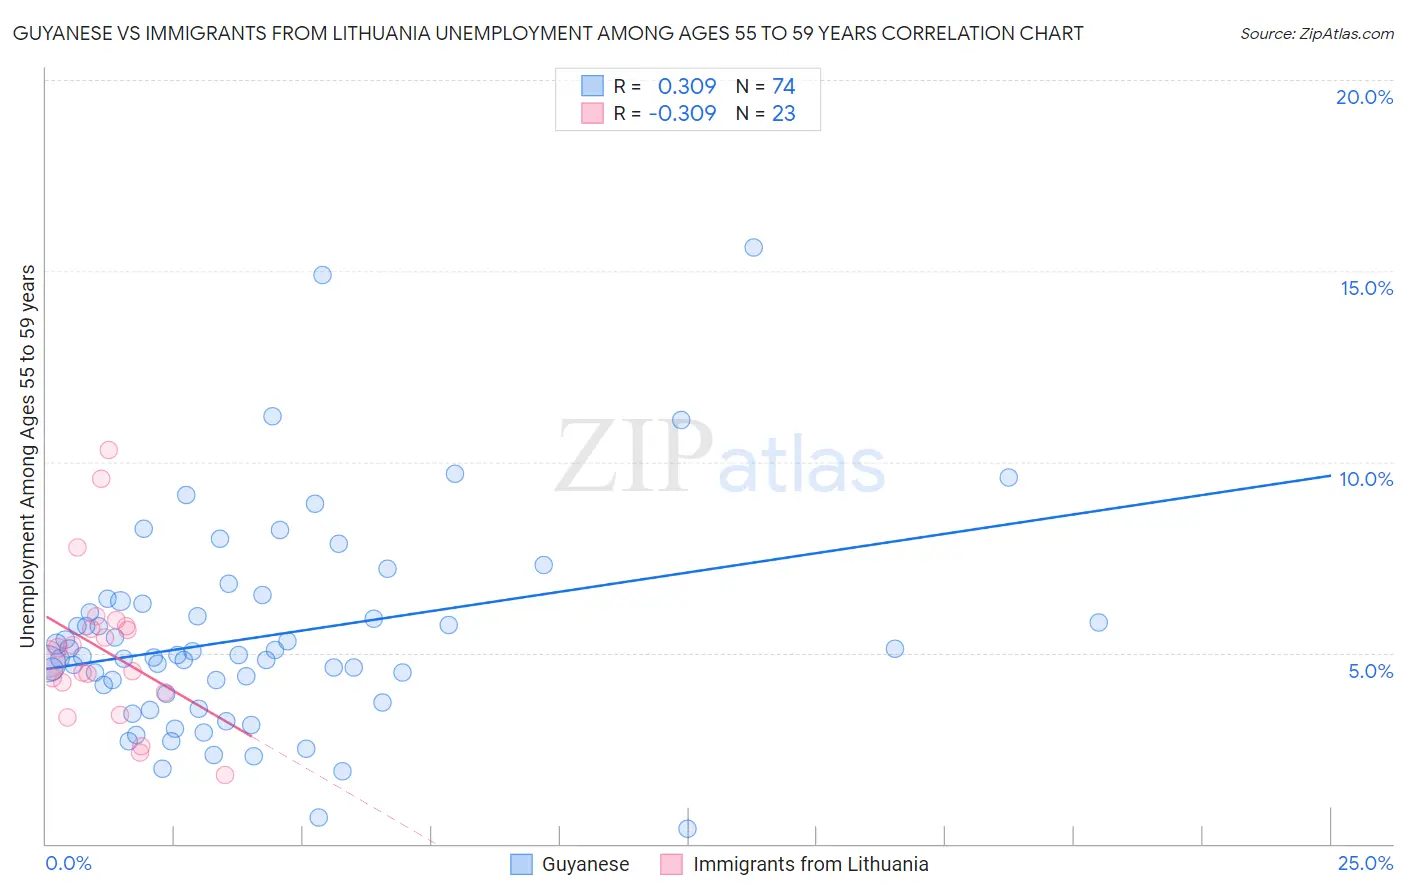
Guyanese vs Immigrants from Lithuania Unemployment Among Ages 55 to 59 years Correlation Chart
The statistical analysis conducted on geographies consisting of 171,113,003 people shows a mild positive correlation between the proportion of Guyanese and unemployment rate among population between the ages 55 and 59 in the United States with a correlation coefficient (R) of 0.309 and weighted average of 5.7%. Similarly, the statistical analysis conducted on geographies consisting of 115,061,362 people shows a mild negative correlation between the proportion of Immigrants from Lithuania and unemployment rate among population between the ages 55 and 59 in the United States with a correlation coefficient (R) of -0.309 and weighted average of 4.8%, a difference of 18.8%.
Unemployment Among Ages 55 to 59 years Correlation Summary
| Measurement | Guyanese | Immigrants from Lithuania |
| Minimum | 0.40% | 1.8% |
| Maximum | 15.6% | 10.3% |
| Range | 15.2% | 8.5% |
| Mean | 5.4% | 5.1% |
| Median | 4.9% | 4.8% |
| Interquartile 25% (IQ1) | 3.9% | 4.0% |
| Interquartile 75% (IQ3) | 6.3% | 5.7% |
| Interquartile Range (IQR) | 2.4% | 1.7% |
| Standard Deviation (Sample) | 2.7% | 2.0% |
| Standard Deviation (Population) | 2.7% | 2.0% |
Similar Demographics by Unemployment Among Ages 55 to 59 years
Demographics Similar to Guyanese by Unemployment Among Ages 55 to 59 years
In terms of unemployment among ages 55 to 59 years, the demographic groups most similar to Guyanese are Tlingit-Haida (5.7%, a difference of 0.15%), Immigrants from Ecuador (5.7%, a difference of 0.20%), Hmong (5.7%, a difference of 0.42%), Central American Indian (5.6%, a difference of 0.44%), and Ecuadorian (5.6%, a difference of 0.63%).
| Demographics | Rating | Rank | Unemployment Among Ages 55 to 59 years |
| Spanish American Indians | 0.0 /100 | #308 | Tragic 5.6% |
| Nepalese | 0.0 /100 | #309 | Tragic 5.6% |
| Belizeans | 0.0 /100 | #310 | Tragic 5.6% |
| Houma | 0.0 /100 | #311 | Tragic 5.6% |
| Ecuadorians | 0.0 /100 | #312 | Tragic 5.6% |
| Central American Indians | 0.0 /100 | #313 | Tragic 5.6% |
| Tlingit-Haida | 0.0 /100 | #314 | Tragic 5.7% |
| Guyanese | 0.0 /100 | #315 | Tragic 5.7% |
| Immigrants | Ecuador | 0.0 /100 | #316 | Tragic 5.7% |
| Hmong | 0.0 /100 | #317 | Tragic 5.7% |
| Immigrants | Guyana | 0.0 /100 | #318 | Tragic 5.8% |
| Kiowa | 0.0 /100 | #319 | Tragic 5.8% |
| Immigrants | Azores | 0.0 /100 | #320 | Tragic 5.8% |
| Chippewa | 0.0 /100 | #321 | Tragic 5.9% |
| Crow | 0.0 /100 | #322 | Tragic 5.9% |
Demographics Similar to Immigrants from Lithuania by Unemployment Among Ages 55 to 59 years
In terms of unemployment among ages 55 to 59 years, the demographic groups most similar to Immigrants from Lithuania are Immigrants from Bahamas (4.8%, a difference of 0.050%), Immigrants from Northern Africa (4.8%, a difference of 0.050%), Bahamian (4.8%, a difference of 0.11%), Laotian (4.8%, a difference of 0.13%), and Immigrants from Uruguay (4.8%, a difference of 0.17%).
| Demographics | Rating | Rank | Unemployment Among Ages 55 to 59 years |
| Immigrants | Norway | 79.8 /100 | #142 | Good 4.8% |
| Ukrainians | 78.6 /100 | #143 | Good 4.8% |
| Immigrants | Asia | 77.8 /100 | #144 | Good 4.8% |
| Immigrants | Northern Europe | 77.5 /100 | #145 | Good 4.8% |
| Immigrants | South Eastern Asia | 77.4 /100 | #146 | Good 4.8% |
| Immigrants | Singapore | 76.6 /100 | #147 | Good 4.8% |
| Immigrants | Bahamas | 71.8 /100 | #148 | Good 4.8% |
| Immigrants | Lithuania | 70.8 /100 | #149 | Good 4.8% |
| Immigrants | Northern Africa | 69.8 /100 | #150 | Good 4.8% |
| Bahamians | 68.6 /100 | #151 | Good 4.8% |
| Laotians | 68.2 /100 | #152 | Good 4.8% |
| Immigrants | Uruguay | 67.2 /100 | #153 | Good 4.8% |
| Immigrants | Panama | 66.8 /100 | #154 | Good 4.8% |
| Immigrants | North Macedonia | 66.3 /100 | #155 | Good 4.8% |
| Italians | 66.2 /100 | #156 | Good 4.8% |