Guyanese vs Pima Unemployment Among Ages 55 to 59 years
COMPARE
Guyanese
Pima
Unemployment Among Ages 55 to 59 years
Unemployment Among Ages 55 to 59 years Comparison
Guyanese
Pima
5.7%
UNEMPLOYMENT AMONG AGES 55 TO 59 YEARS
0.0/ 100
METRIC RATING
315th/ 347
METRIC RANK
6.6%
UNEMPLOYMENT AMONG AGES 55 TO 59 YEARS
0.0/ 100
METRIC RATING
333rd/ 347
METRIC RANK
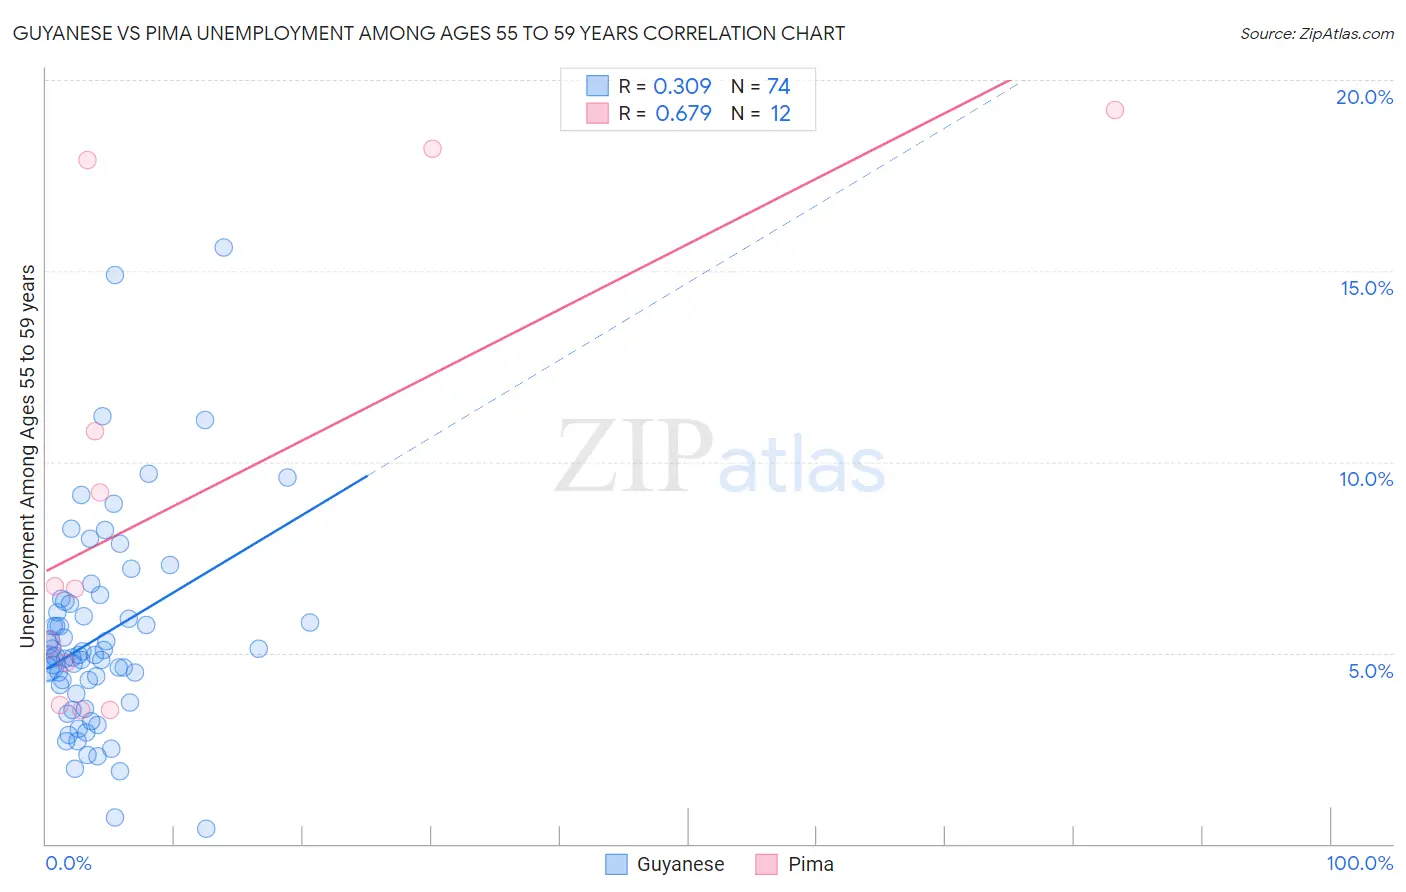
Guyanese vs Pima Unemployment Among Ages 55 to 59 years Correlation Chart
The statistical analysis conducted on geographies consisting of 171,113,003 people shows a mild positive correlation between the proportion of Guyanese and unemployment rate among population between the ages 55 and 59 in the United States with a correlation coefficient (R) of 0.309 and weighted average of 5.7%. Similarly, the statistical analysis conducted on geographies consisting of 60,402,729 people shows a significant positive correlation between the proportion of Pima and unemployment rate among population between the ages 55 and 59 in the United States with a correlation coefficient (R) of 0.679 and weighted average of 6.6%, a difference of 16.7%.
Unemployment Among Ages 55 to 59 years Correlation Summary
| Measurement | Guyanese | Pima |
| Minimum | 0.40% | 3.5% |
| Maximum | 15.6% | 19.2% |
| Range | 15.2% | 15.7% |
| Mean | 5.4% | 9.1% |
| Median | 4.9% | 6.7% |
| Interquartile 25% (IQ1) | 3.9% | 4.2% |
| Interquartile 75% (IQ3) | 6.3% | 14.3% |
| Interquartile Range (IQR) | 2.4% | 10.2% |
| Standard Deviation (Sample) | 2.7% | 6.1% |
| Standard Deviation (Population) | 2.7% | 5.8% |
Demographics Similar to Guyanese and Pima by Unemployment Among Ages 55 to 59 years
In terms of unemployment among ages 55 to 59 years, the demographic groups most similar to Guyanese are Tlingit-Haida (5.7%, a difference of 0.15%), Immigrants from Ecuador (5.7%, a difference of 0.20%), Hmong (5.7%, a difference of 0.42%), Immigrants from Guyana (5.8%, a difference of 1.4%), and Kiowa (5.8%, a difference of 1.4%). Similarly, the demographic groups most similar to Pima are Pueblo (6.7%, a difference of 1.2%), Aleut (6.4%, a difference of 2.8%), Immigrants from Dominican Republic (6.3%, a difference of 5.3%), Alaska Native (6.2%, a difference of 6.0%), and Dominican (6.2%, a difference of 6.5%).
| Demographics | Rating | Rank | Unemployment Among Ages 55 to 59 years |
| Tlingit-Haida | 0.0 /100 | #314 | Tragic 5.7% |
| Guyanese | 0.0 /100 | #315 | Tragic 5.7% |
| Immigrants | Ecuador | 0.0 /100 | #316 | Tragic 5.7% |
| Hmong | 0.0 /100 | #317 | Tragic 5.7% |
| Immigrants | Guyana | 0.0 /100 | #318 | Tragic 5.8% |
| Kiowa | 0.0 /100 | #319 | Tragic 5.8% |
| Immigrants | Azores | 0.0 /100 | #320 | Tragic 5.8% |
| Chippewa | 0.0 /100 | #321 | Tragic 5.9% |
| Crow | 0.0 /100 | #322 | Tragic 5.9% |
| Immigrants | Bangladesh | 0.0 /100 | #323 | Tragic 5.9% |
| Vietnamese | 0.0 /100 | #324 | Tragic 5.9% |
| Immigrants | Armenia | 0.0 /100 | #325 | Tragic 6.0% |
| Natives/Alaskans | 0.0 /100 | #326 | Tragic 6.0% |
| Arapaho | 0.0 /100 | #327 | Tragic 6.1% |
| Yuman | 0.0 /100 | #328 | Tragic 6.1% |
| Dominicans | 0.0 /100 | #329 | Tragic 6.2% |
| Alaska Natives | 0.0 /100 | #330 | Tragic 6.2% |
| Immigrants | Dominican Republic | 0.0 /100 | #331 | Tragic 6.3% |
| Aleuts | 0.0 /100 | #332 | Tragic 6.4% |
| Pima | 0.0 /100 | #333 | Tragic 6.6% |
| Pueblo | 0.0 /100 | #334 | Tragic 6.7% |