Guyanese vs West Indian Unemployment Among Ages 55 to 59 years
COMPARE
Guyanese
West Indian
Unemployment Among Ages 55 to 59 years
Unemployment Among Ages 55 to 59 years Comparison
Guyanese
West Indians
5.7%
UNEMPLOYMENT AMONG AGES 55 TO 59 YEARS
0.0/ 100
METRIC RATING
315th/ 347
METRIC RANK
5.2%
UNEMPLOYMENT AMONG AGES 55 TO 59 YEARS
0.0/ 100
METRIC RATING
276th/ 347
METRIC RANK
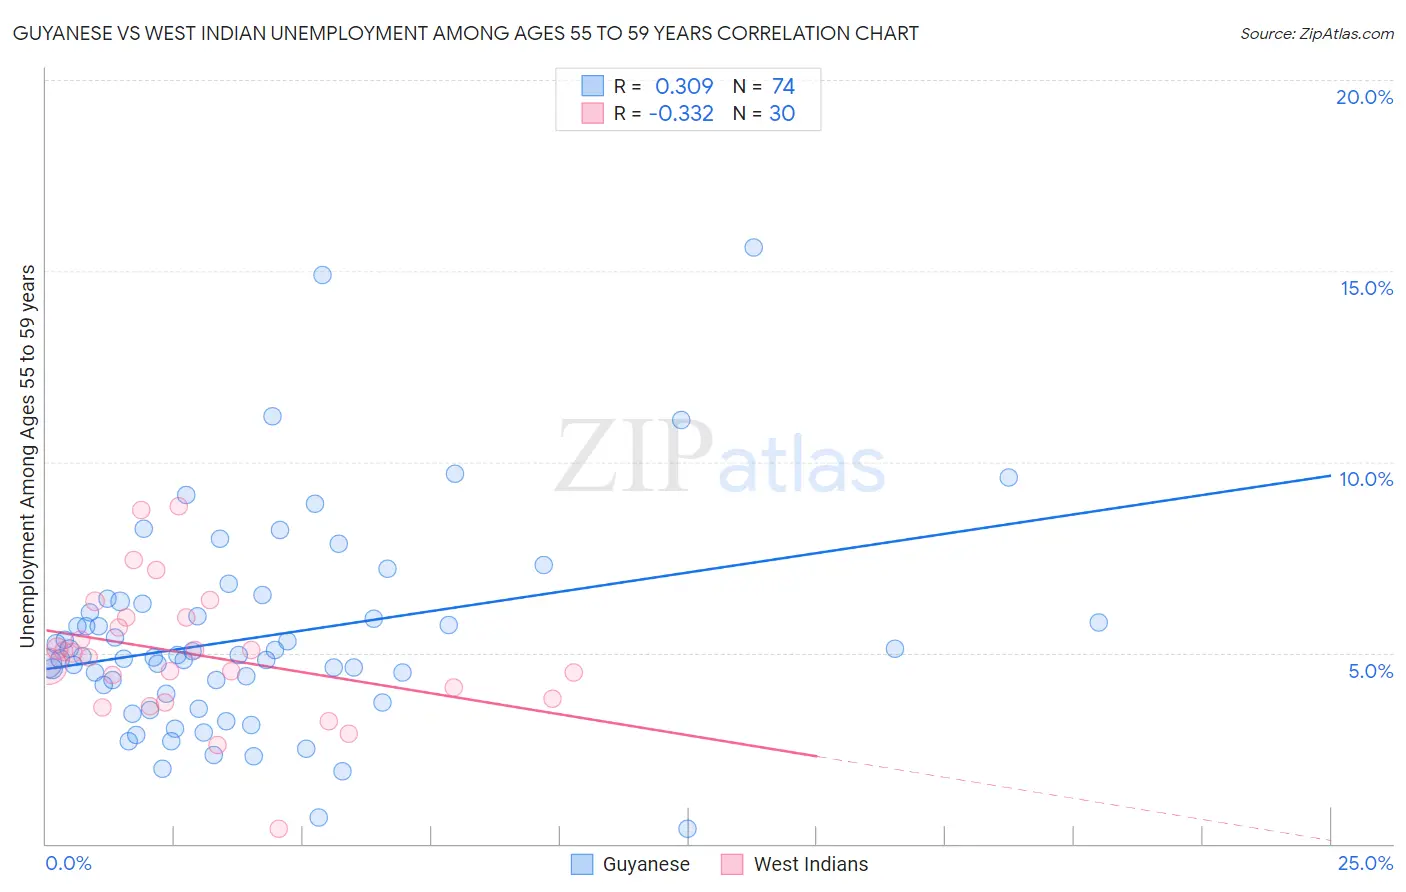
Guyanese vs West Indian Unemployment Among Ages 55 to 59 years Correlation Chart
The statistical analysis conducted on geographies consisting of 171,113,003 people shows a mild positive correlation between the proportion of Guyanese and unemployment rate among population between the ages 55 and 59 in the United States with a correlation coefficient (R) of 0.309 and weighted average of 5.7%. Similarly, the statistical analysis conducted on geographies consisting of 243,325,614 people shows a mild negative correlation between the proportion of West Indians and unemployment rate among population between the ages 55 and 59 in the United States with a correlation coefficient (R) of -0.332 and weighted average of 5.2%, a difference of 8.6%.
Unemployment Among Ages 55 to 59 years Correlation Summary
| Measurement | Guyanese | West Indian |
| Minimum | 0.40% | 0.40% |
| Maximum | 15.6% | 8.8% |
| Range | 15.2% | 8.4% |
| Mean | 5.4% | 4.9% |
| Median | 4.9% | 4.9% |
| Interquartile 25% (IQ1) | 3.9% | 3.8% |
| Interquartile 75% (IQ3) | 6.3% | 5.9% |
| Interquartile Range (IQR) | 2.4% | 2.1% |
| Standard Deviation (Sample) | 2.7% | 1.8% |
| Standard Deviation (Population) | 2.7% | 1.7% |
Similar Demographics by Unemployment Among Ages 55 to 59 years
Demographics Similar to Guyanese by Unemployment Among Ages 55 to 59 years
In terms of unemployment among ages 55 to 59 years, the demographic groups most similar to Guyanese are Tlingit-Haida (5.7%, a difference of 0.15%), Immigrants from Ecuador (5.7%, a difference of 0.20%), Hmong (5.7%, a difference of 0.42%), Central American Indian (5.6%, a difference of 0.44%), and Ecuadorian (5.6%, a difference of 0.63%).
| Demographics | Rating | Rank | Unemployment Among Ages 55 to 59 years |
| Spanish American Indians | 0.0 /100 | #308 | Tragic 5.6% |
| Nepalese | 0.0 /100 | #309 | Tragic 5.6% |
| Belizeans | 0.0 /100 | #310 | Tragic 5.6% |
| Houma | 0.0 /100 | #311 | Tragic 5.6% |
| Ecuadorians | 0.0 /100 | #312 | Tragic 5.6% |
| Central American Indians | 0.0 /100 | #313 | Tragic 5.6% |
| Tlingit-Haida | 0.0 /100 | #314 | Tragic 5.7% |
| Guyanese | 0.0 /100 | #315 | Tragic 5.7% |
| Immigrants | Ecuador | 0.0 /100 | #316 | Tragic 5.7% |
| Hmong | 0.0 /100 | #317 | Tragic 5.7% |
| Immigrants | Guyana | 0.0 /100 | #318 | Tragic 5.8% |
| Kiowa | 0.0 /100 | #319 | Tragic 5.8% |
| Immigrants | Azores | 0.0 /100 | #320 | Tragic 5.8% |
| Chippewa | 0.0 /100 | #321 | Tragic 5.9% |
| Crow | 0.0 /100 | #322 | Tragic 5.9% |
Demographics Similar to West Indians by Unemployment Among Ages 55 to 59 years
In terms of unemployment among ages 55 to 59 years, the demographic groups most similar to West Indians are Israeli (5.2%, a difference of 0.010%), Mexican American Indian (5.2%, a difference of 0.11%), Immigrants from Latin America (5.2%, a difference of 0.12%), Ottawa (5.2%, a difference of 0.23%), and Immigrants from Barbados (5.2%, a difference of 0.30%).
| Demographics | Rating | Rank | Unemployment Among Ages 55 to 59 years |
| Tsimshian | 0.1 /100 | #269 | Tragic 5.2% |
| Ute | 0.1 /100 | #270 | Tragic 5.2% |
| Cree | 0.1 /100 | #271 | Tragic 5.2% |
| Immigrants | Jamaica | 0.0 /100 | #272 | Tragic 5.2% |
| Ottawa | 0.0 /100 | #273 | Tragic 5.2% |
| Mexican American Indians | 0.0 /100 | #274 | Tragic 5.2% |
| Israelis | 0.0 /100 | #275 | Tragic 5.2% |
| West Indians | 0.0 /100 | #276 | Tragic 5.2% |
| Immigrants | Latin America | 0.0 /100 | #277 | Tragic 5.2% |
| Immigrants | Barbados | 0.0 /100 | #278 | Tragic 5.2% |
| Alsatians | 0.0 /100 | #279 | Tragic 5.2% |
| Immigrants | Uzbekistan | 0.0 /100 | #280 | Tragic 5.3% |
| Guatemalans | 0.0 /100 | #281 | Tragic 5.3% |
| Immigrants | Trinidad and Tobago | 0.0 /100 | #282 | Tragic 5.3% |
| Apache | 0.0 /100 | #283 | Tragic 5.3% |