Guyanese vs Delaware Unemployment Among Seniors over 75 years
COMPARE
Guyanese
Delaware
Unemployment Among Seniors over 75 years
Unemployment Among Seniors over 75 years Comparison
Guyanese
Delaware
7.6%
UNEMPLOYMENT AMONG SENIORS OVER 75 YEARS
100.0/ 100
METRIC RATING
31st/ 347
METRIC RANK
9.0%
UNEMPLOYMENT AMONG SENIORS OVER 75 YEARS
14.6/ 100
METRIC RATING
211th/ 347
METRIC RANK
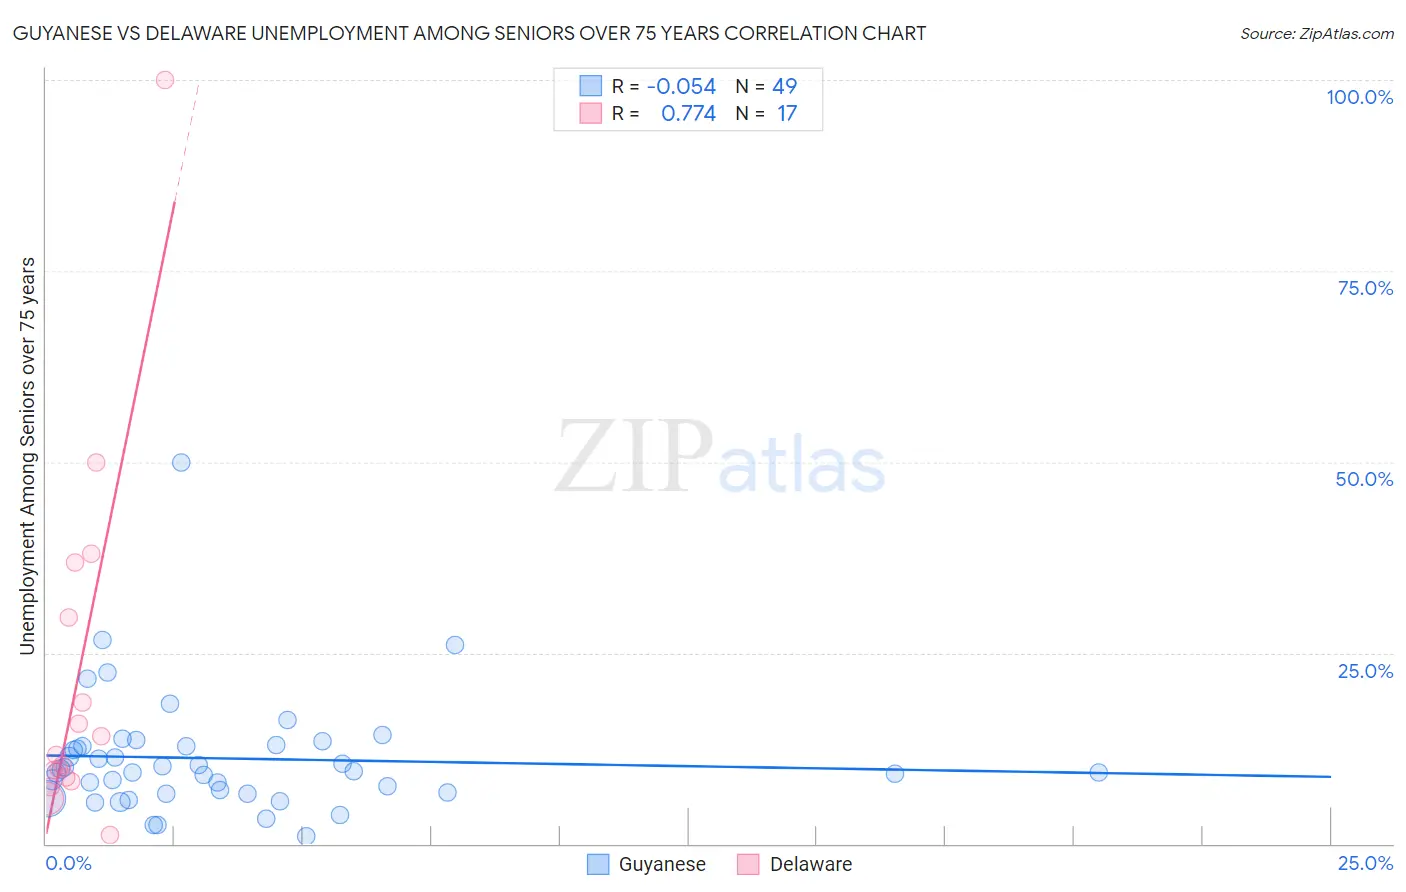
Guyanese vs Delaware Unemployment Among Seniors over 75 years Correlation Chart
The statistical analysis conducted on geographies consisting of 115,232,010 people shows a slight negative correlation between the proportion of Guyanese and unemployment rate among seniors over the age of 75 in the United States with a correlation coefficient (R) of -0.054 and weighted average of 7.6%. Similarly, the statistical analysis conducted on geographies consisting of 70,404,078 people shows a strong positive correlation between the proportion of Delaware and unemployment rate among seniors over the age of 75 in the United States with a correlation coefficient (R) of 0.774 and weighted average of 9.0%, a difference of 17.6%.
Unemployment Among Seniors over 75 years Correlation Summary
| Measurement | Guyanese | Delaware |
| Minimum | 1.0% | 1.2% |
| Maximum | 50.0% | 100.0% |
| Range | 49.0% | 98.8% |
| Mean | 11.2% | 22.1% |
| Median | 9.5% | 11.7% |
| Interquartile 25% (IQ1) | 6.7% | 8.5% |
| Interquartile 75% (IQ3) | 12.9% | 33.2% |
| Interquartile Range (IQR) | 6.2% | 24.7% |
| Standard Deviation (Sample) | 7.9% | 24.2% |
| Standard Deviation (Population) | 7.8% | 23.4% |
Similar Demographics by Unemployment Among Seniors over 75 years
Demographics Similar to Guyanese by Unemployment Among Seniors over 75 years
In terms of unemployment among seniors over 75 years, the demographic groups most similar to Guyanese are Immigrants from Sweden (7.6%, a difference of 0.37%), Immigrants from Iran (7.6%, a difference of 0.48%), Immigrants from Hong Kong (7.6%, a difference of 0.50%), Cambodian (7.6%, a difference of 0.51%), and Immigrants from Israel (7.6%, a difference of 0.53%).
| Demographics | Rating | Rank | Unemployment Among Seniors over 75 years |
| Immigrants | Cuba | 100.0 /100 | #24 | Exceptional 7.4% |
| Immigrants | Uruguay | 100.0 /100 | #25 | Exceptional 7.5% |
| South Africans | 100.0 /100 | #26 | Exceptional 7.5% |
| Immigrants | Barbados | 100.0 /100 | #27 | Exceptional 7.6% |
| Immigrants | Israel | 100.0 /100 | #28 | Exceptional 7.6% |
| Immigrants | Iran | 100.0 /100 | #29 | Exceptional 7.6% |
| Immigrants | Sweden | 100.0 /100 | #30 | Exceptional 7.6% |
| Guyanese | 100.0 /100 | #31 | Exceptional 7.6% |
| Immigrants | Hong Kong | 100.0 /100 | #32 | Exceptional 7.6% |
| Cambodians | 100.0 /100 | #33 | Exceptional 7.6% |
| Immigrants | Eritrea | 100.0 /100 | #34 | Exceptional 7.7% |
| Immigrants | Norway | 100.0 /100 | #35 | Exceptional 7.7% |
| Luxembourgers | 100.0 /100 | #36 | Exceptional 7.7% |
| Immigrants | Hungary | 100.0 /100 | #37 | Exceptional 7.7% |
| Kiowa | 100.0 /100 | #38 | Exceptional 7.7% |
Demographics Similar to Delaware by Unemployment Among Seniors over 75 years
In terms of unemployment among seniors over 75 years, the demographic groups most similar to Delaware are Bermudan (8.9%, a difference of 0.050%), Salvadoran (8.9%, a difference of 0.080%), Romanian (9.0%, a difference of 0.080%), Immigrants from Latin America (9.0%, a difference of 0.12%), and Immigrants from Philippines (8.9%, a difference of 0.13%).
| Demographics | Rating | Rank | Unemployment Among Seniors over 75 years |
| Spaniards | 22.0 /100 | #204 | Fair 8.9% |
| Koreans | 21.9 /100 | #205 | Fair 8.9% |
| Immigrants | Western Europe | 18.2 /100 | #206 | Poor 8.9% |
| Malaysians | 16.3 /100 | #207 | Poor 8.9% |
| Immigrants | Philippines | 15.8 /100 | #208 | Poor 8.9% |
| Salvadorans | 15.4 /100 | #209 | Poor 8.9% |
| Bermudans | 15.0 /100 | #210 | Poor 8.9% |
| Delaware | 14.6 /100 | #211 | Poor 9.0% |
| Romanians | 13.8 /100 | #212 | Poor 9.0% |
| Immigrants | Latin America | 13.4 /100 | #213 | Poor 9.0% |
| Immigrants | Brazil | 13.3 /100 | #214 | Poor 9.0% |
| Immigrants | Western Asia | 12.5 /100 | #215 | Poor 9.0% |
| Immigrants | Oceania | 11.8 /100 | #216 | Poor 9.0% |
| Lebanese | 11.1 /100 | #217 | Poor 9.0% |
| Immigrants | Africa | 9.7 /100 | #218 | Tragic 9.0% |