Guyanese vs Paiute Unemployment Among Seniors over 75 years
COMPARE
Guyanese
Paiute
Unemployment Among Seniors over 75 years
Unemployment Among Seniors over 75 years Comparison
Guyanese
Paiute
7.6%
UNEMPLOYMENT AMONG SENIORS OVER 75 YEARS
100.0/ 100
METRIC RATING
31st/ 347
METRIC RANK
8.6%
UNEMPLOYMENT AMONG SENIORS OVER 75 YEARS
82.5/ 100
METRIC RATING
150th/ 347
METRIC RANK
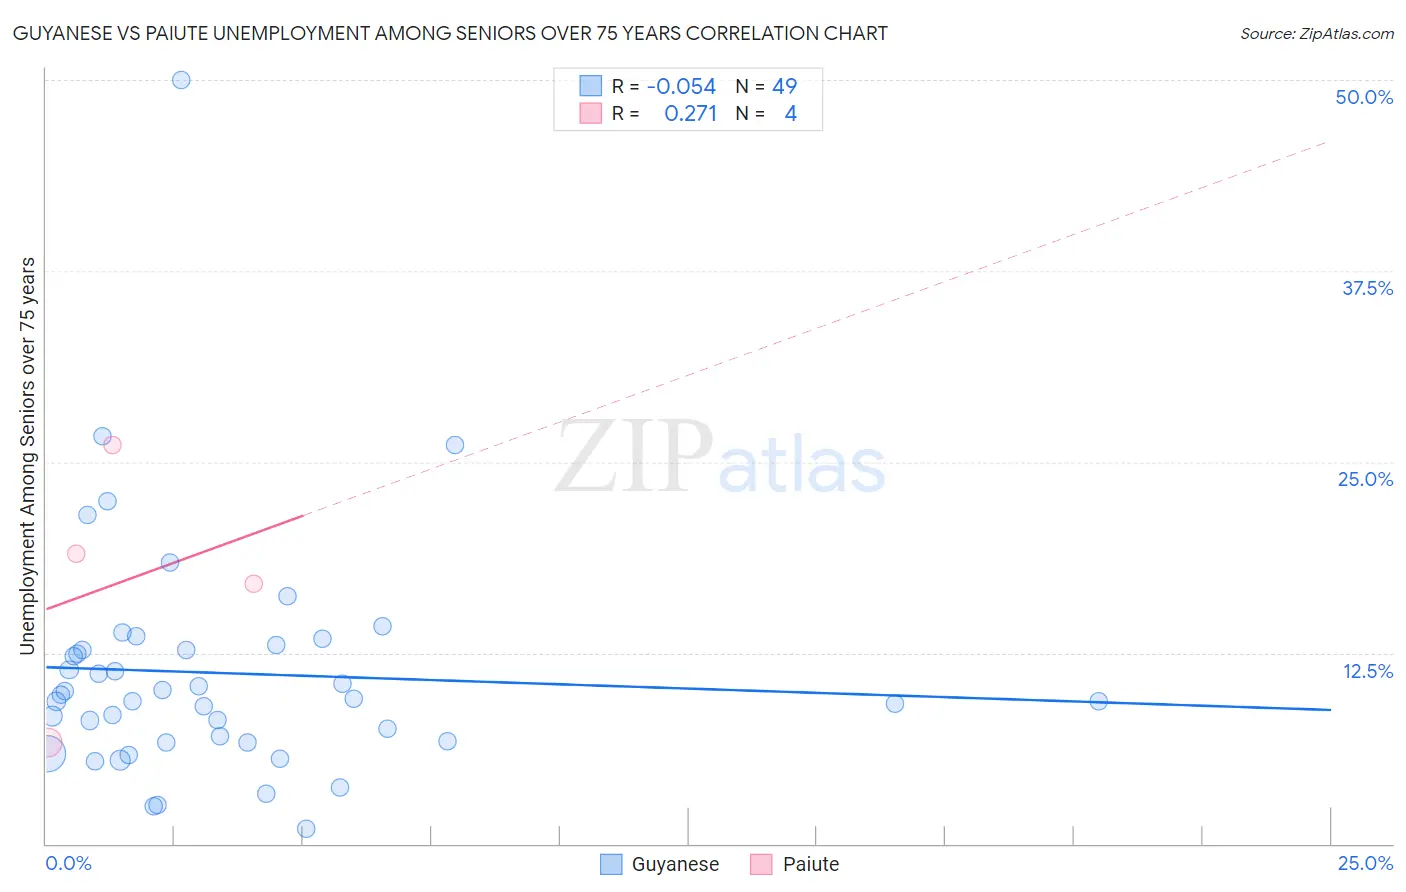
Guyanese vs Paiute Unemployment Among Seniors over 75 years Correlation Chart
The statistical analysis conducted on geographies consisting of 115,232,010 people shows a slight negative correlation between the proportion of Guyanese and unemployment rate among seniors over the age of 75 in the United States with a correlation coefficient (R) of -0.054 and weighted average of 7.6%. Similarly, the statistical analysis conducted on geographies consisting of 47,269,504 people shows a weak positive correlation between the proportion of Paiute and unemployment rate among seniors over the age of 75 in the United States with a correlation coefficient (R) of 0.271 and weighted average of 8.6%, a difference of 12.5%.
Unemployment Among Seniors over 75 years Correlation Summary
| Measurement | Guyanese | Paiute |
| Minimum | 1.0% | 6.6% |
| Maximum | 50.0% | 26.1% |
| Range | 49.0% | 19.5% |
| Mean | 11.2% | 17.2% |
| Median | 9.5% | 18.0% |
| Interquartile 25% (IQ1) | 6.7% | 11.8% |
| Interquartile 75% (IQ3) | 12.9% | 22.5% |
| Interquartile Range (IQR) | 6.2% | 10.7% |
| Standard Deviation (Sample) | 7.9% | 8.1% |
| Standard Deviation (Population) | 7.8% | 7.0% |
Similar Demographics by Unemployment Among Seniors over 75 years
Demographics Similar to Guyanese by Unemployment Among Seniors over 75 years
In terms of unemployment among seniors over 75 years, the demographic groups most similar to Guyanese are Immigrants from Sweden (7.6%, a difference of 0.37%), Immigrants from Iran (7.6%, a difference of 0.48%), Immigrants from Hong Kong (7.6%, a difference of 0.50%), Cambodian (7.6%, a difference of 0.51%), and Immigrants from Israel (7.6%, a difference of 0.53%).
| Demographics | Rating | Rank | Unemployment Among Seniors over 75 years |
| Immigrants | Cuba | 100.0 /100 | #24 | Exceptional 7.4% |
| Immigrants | Uruguay | 100.0 /100 | #25 | Exceptional 7.5% |
| South Africans | 100.0 /100 | #26 | Exceptional 7.5% |
| Immigrants | Barbados | 100.0 /100 | #27 | Exceptional 7.6% |
| Immigrants | Israel | 100.0 /100 | #28 | Exceptional 7.6% |
| Immigrants | Iran | 100.0 /100 | #29 | Exceptional 7.6% |
| Immigrants | Sweden | 100.0 /100 | #30 | Exceptional 7.6% |
| Guyanese | 100.0 /100 | #31 | Exceptional 7.6% |
| Immigrants | Hong Kong | 100.0 /100 | #32 | Exceptional 7.6% |
| Cambodians | 100.0 /100 | #33 | Exceptional 7.6% |
| Immigrants | Eritrea | 100.0 /100 | #34 | Exceptional 7.7% |
| Immigrants | Norway | 100.0 /100 | #35 | Exceptional 7.7% |
| Luxembourgers | 100.0 /100 | #36 | Exceptional 7.7% |
| Immigrants | Hungary | 100.0 /100 | #37 | Exceptional 7.7% |
| Kiowa | 100.0 /100 | #38 | Exceptional 7.7% |
Demographics Similar to Paiute by Unemployment Among Seniors over 75 years
In terms of unemployment among seniors over 75 years, the demographic groups most similar to Paiute are Immigrants from Bosnia and Herzegovina (8.6%, a difference of 0.17%), Latvian (8.6%, a difference of 0.18%), Immigrants from Ecuador (8.5%, a difference of 0.21%), Mongolian (8.6%, a difference of 0.21%), and Immigrants from Pakistan (8.6%, a difference of 0.25%).
| Demographics | Rating | Rank | Unemployment Among Seniors over 75 years |
| Immigrants | Costa Rica | 86.8 /100 | #143 | Excellent 8.5% |
| Colombians | 86.7 /100 | #144 | Excellent 8.5% |
| Immigrants | Romania | 86.2 /100 | #145 | Excellent 8.5% |
| Immigrants | South Eastern Asia | 85.8 /100 | #146 | Excellent 8.5% |
| Immigrants | Sierra Leone | 85.6 /100 | #147 | Excellent 8.5% |
| Immigrants | Colombia | 85.6 /100 | #148 | Excellent 8.5% |
| Immigrants | Ecuador | 84.6 /100 | #149 | Excellent 8.5% |
| Paiute | 82.5 /100 | #150 | Excellent 8.6% |
| Immigrants | Bosnia and Herzegovina | 80.6 /100 | #151 | Excellent 8.6% |
| Latvians | 80.5 /100 | #152 | Excellent 8.6% |
| Mongolians | 80.1 /100 | #153 | Excellent 8.6% |
| Immigrants | Pakistan | 79.7 /100 | #154 | Good 8.6% |
| Ecuadorians | 78.5 /100 | #155 | Good 8.6% |
| Immigrants | Bahamas | 76.5 /100 | #156 | Good 8.6% |
| Turks | 76.4 /100 | #157 | Good 8.6% |