Guamanian/Chamorro vs Immigrants from Chile Unemployment Among Ages 60 to 64 years
COMPARE
Guamanian/Chamorro
Immigrants from Chile
Unemployment Among Ages 60 to 64 years
Unemployment Among Ages 60 to 64 years Comparison
Guamanians/Chamorros
Immigrants from Chile
4.9%
UNEMPLOYMENT AMONG AGES 60 TO 64 YEARS
23.7/ 100
METRIC RATING
198th/ 347
METRIC RANK
5.0%
UNEMPLOYMENT AMONG AGES 60 TO 64 YEARS
6.8/ 100
METRIC RATING
226th/ 347
METRIC RANK
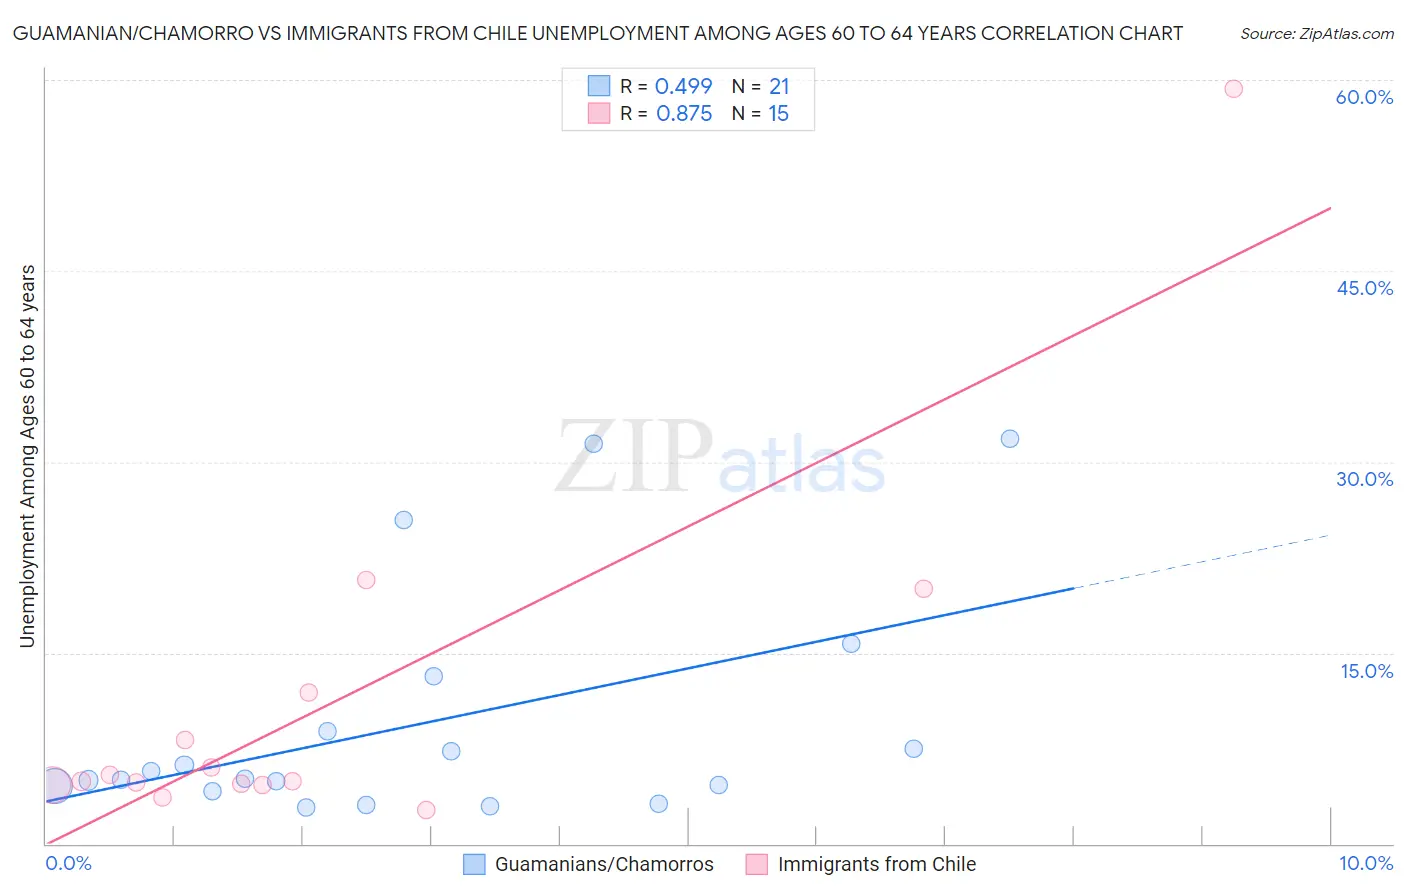
Guamanian/Chamorro vs Immigrants from Chile Unemployment Among Ages 60 to 64 years Correlation Chart
The statistical analysis conducted on geographies consisting of 209,235,205 people shows a moderate positive correlation between the proportion of Guamanians/Chamorros and unemployment rate among population between the ages 60 and 64 in the United States with a correlation coefficient (R) of 0.499 and weighted average of 4.9%. Similarly, the statistical analysis conducted on geographies consisting of 209,441,253 people shows a very strong positive correlation between the proportion of Immigrants from Chile and unemployment rate among population between the ages 60 and 64 in the United States with a correlation coefficient (R) of 0.875 and weighted average of 5.0%, a difference of 1.3%.
Unemployment Among Ages 60 to 64 years Correlation Summary
| Measurement | Guamanian/Chamorro | Immigrants from Chile |
| Minimum | 2.8% | 2.7% |
| Maximum | 31.8% | 59.3% |
| Range | 29.0% | 56.6% |
| Mean | 9.4% | 11.1% |
| Median | 5.1% | 5.0% |
| Interquartile 25% (IQ1) | 4.3% | 4.6% |
| Interquartile 75% (IQ3) | 11.0% | 11.9% |
| Interquartile Range (IQR) | 6.6% | 7.2% |
| Standard Deviation (Sample) | 9.1% | 14.5% |
| Standard Deviation (Population) | 8.8% | 14.0% |
Similar Demographics by Unemployment Among Ages 60 to 64 years
Demographics Similar to Guamanians/Chamorros by Unemployment Among Ages 60 to 64 years
In terms of unemployment among ages 60 to 64 years, the demographic groups most similar to Guamanians/Chamorros are Immigrants from Vietnam (4.9%, a difference of 0.0%), Immigrants from Czechoslovakia (4.9%, a difference of 0.010%), Colombian (4.9%, a difference of 0.050%), Immigrants from Eastern Europe (4.9%, a difference of 0.070%), and Immigrants from Asia (4.9%, a difference of 0.090%).
| Demographics | Rating | Rank | Unemployment Among Ages 60 to 64 years |
| Immigrants | Nigeria | 29.6 /100 | #191 | Fair 4.9% |
| Menominee | 28.8 /100 | #192 | Fair 4.9% |
| Houma | 28.3 /100 | #193 | Fair 4.9% |
| Immigrants | Colombia | 26.8 /100 | #194 | Fair 4.9% |
| Immigrants | Austria | 26.6 /100 | #195 | Fair 4.9% |
| Immigrants | Asia | 25.7 /100 | #196 | Fair 4.9% |
| Immigrants | Eastern Europe | 25.2 /100 | #197 | Fair 4.9% |
| Guamanians/Chamorros | 23.7 /100 | #198 | Fair 4.9% |
| Immigrants | Vietnam | 23.7 /100 | #199 | Fair 4.9% |
| Immigrants | Czechoslovakia | 23.5 /100 | #200 | Fair 4.9% |
| Colombians | 22.7 /100 | #201 | Fair 4.9% |
| Immigrants | Western Africa | 20.6 /100 | #202 | Fair 4.9% |
| Uruguayans | 19.9 /100 | #203 | Poor 4.9% |
| Russians | 18.9 /100 | #204 | Poor 4.9% |
| Immigrants | Indonesia | 17.4 /100 | #205 | Poor 4.9% |
Demographics Similar to Immigrants from Chile by Unemployment Among Ages 60 to 64 years
In terms of unemployment among ages 60 to 64 years, the demographic groups most similar to Immigrants from Chile are Nigerian (5.0%, a difference of 0.0%), Immigrants from Ireland (5.0%, a difference of 0.050%), Immigrants from Belarus (5.0%, a difference of 0.060%), African (5.0%, a difference of 0.13%), and Immigrants from Denmark (5.0%, a difference of 0.15%).
| Demographics | Rating | Rank | Unemployment Among Ages 60 to 64 years |
| Immigrants | Brazil | 11.7 /100 | #219 | Poor 4.9% |
| Ottawa | 11.6 /100 | #220 | Poor 4.9% |
| Ugandans | 10.5 /100 | #221 | Poor 4.9% |
| Brazilians | 10.1 /100 | #222 | Poor 5.0% |
| Crow | 9.7 /100 | #223 | Tragic 5.0% |
| Immigrants | Cameroon | 8.5 /100 | #224 | Tragic 5.0% |
| Immigrants | Ireland | 7.2 /100 | #225 | Tragic 5.0% |
| Immigrants | Chile | 6.8 /100 | #226 | Tragic 5.0% |
| Nigerians | 6.8 /100 | #227 | Tragic 5.0% |
| Immigrants | Belarus | 6.4 /100 | #228 | Tragic 5.0% |
| Africans | 5.9 /100 | #229 | Tragic 5.0% |
| Immigrants | Denmark | 5.8 /100 | #230 | Tragic 5.0% |
| Tohono O'odham | 5.7 /100 | #231 | Tragic 5.0% |
| Immigrants | Eastern Asia | 4.7 /100 | #232 | Tragic 5.0% |
| Immigrants | Greece | 4.6 /100 | #233 | Tragic 5.0% |