Guamanian/Chamorro vs Sri Lankan Unemployment Among Ages 60 to 64 years
COMPARE
Guamanian/Chamorro
Sri Lankan
Unemployment Among Ages 60 to 64 years
Unemployment Among Ages 60 to 64 years Comparison
Guamanians/Chamorros
Sri Lankans
4.9%
UNEMPLOYMENT AMONG AGES 60 TO 64 YEARS
23.7/ 100
METRIC RATING
198th/ 347
METRIC RANK
4.9%
UNEMPLOYMENT AMONG AGES 60 TO 64 YEARS
39.8/ 100
METRIC RATING
182nd/ 347
METRIC RANK
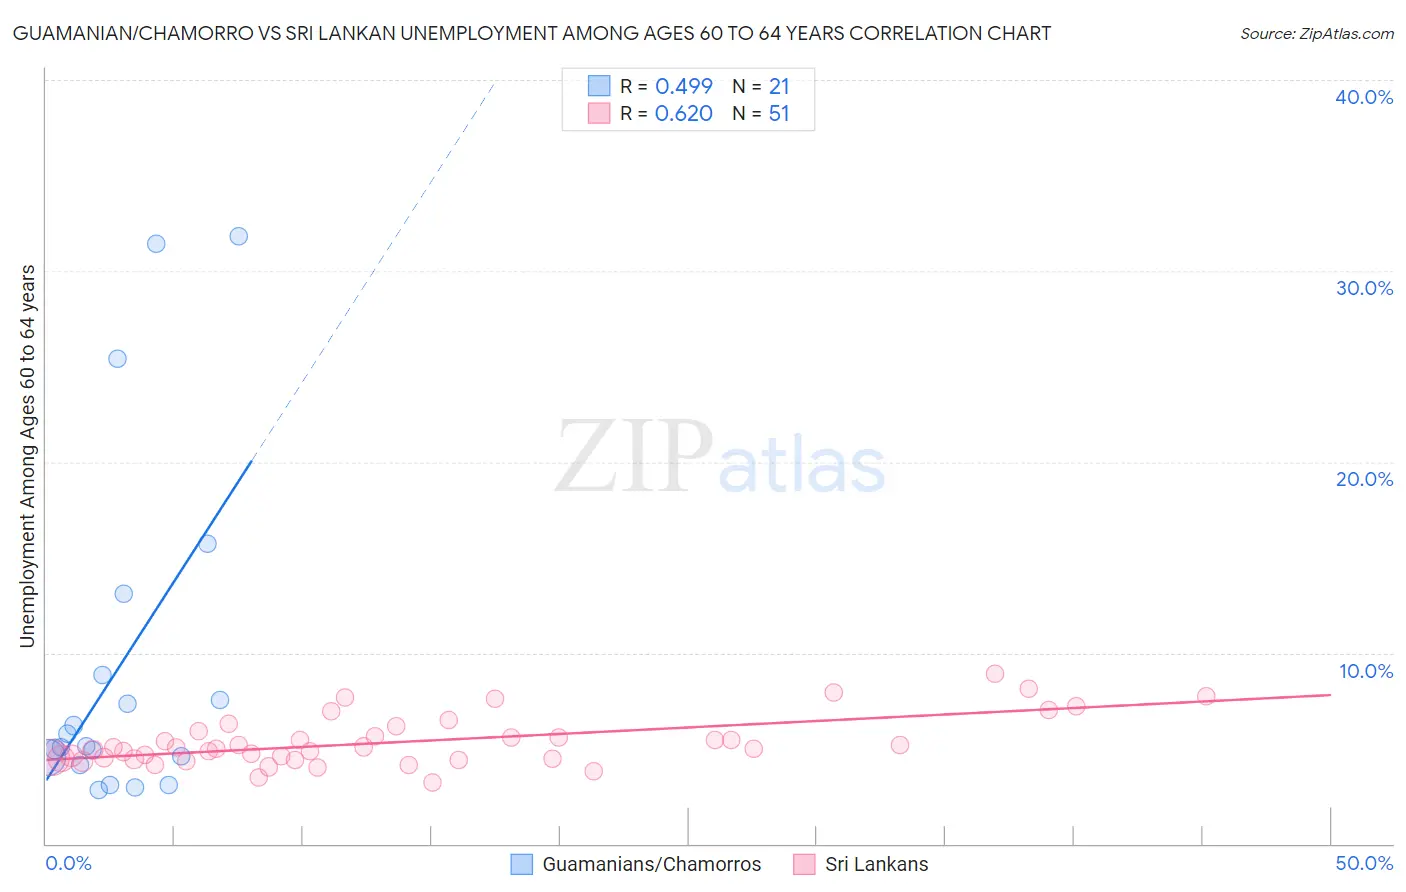
Guamanian/Chamorro vs Sri Lankan Unemployment Among Ages 60 to 64 years Correlation Chart
The statistical analysis conducted on geographies consisting of 209,235,205 people shows a moderate positive correlation between the proportion of Guamanians/Chamorros and unemployment rate among population between the ages 60 and 64 in the United States with a correlation coefficient (R) of 0.499 and weighted average of 4.9%. Similarly, the statistical analysis conducted on geographies consisting of 393,788,798 people shows a significant positive correlation between the proportion of Sri Lankans and unemployment rate among population between the ages 60 and 64 in the United States with a correlation coefficient (R) of 0.620 and weighted average of 4.9%, a difference of 0.66%.
Unemployment Among Ages 60 to 64 years Correlation Summary
| Measurement | Guamanian/Chamorro | Sri Lankan |
| Minimum | 2.8% | 3.2% |
| Maximum | 31.8% | 8.9% |
| Range | 29.0% | 5.7% |
| Mean | 9.4% | 5.3% |
| Median | 5.1% | 5.0% |
| Interquartile 25% (IQ1) | 4.3% | 4.5% |
| Interquartile 75% (IQ3) | 11.0% | 5.9% |
| Interquartile Range (IQR) | 6.6% | 1.4% |
| Standard Deviation (Sample) | 9.1% | 1.3% |
| Standard Deviation (Population) | 8.8% | 1.3% |
Demographics Similar to Guamanians/Chamorros and Sri Lankans by Unemployment Among Ages 60 to 64 years
In terms of unemployment among ages 60 to 64 years, the demographic groups most similar to Guamanians/Chamorros are Immigrants from Vietnam (4.9%, a difference of 0.0%), Immigrants from Czechoslovakia (4.9%, a difference of 0.010%), Immigrants from Eastern Europe (4.9%, a difference of 0.070%), Immigrants from Asia (4.9%, a difference of 0.090%), and Immigrants from Austria (4.9%, a difference of 0.13%). Similarly, the demographic groups most similar to Sri Lankans are Hungarian (4.9%, a difference of 0.030%), Subsaharan African (4.9%, a difference of 0.030%), Asian (4.9%, a difference of 0.040%), Immigrants from Ukraine (4.9%, a difference of 0.080%), and Ute (4.9%, a difference of 0.090%).
| Demographics | Rating | Rank | Unemployment Among Ages 60 to 64 years |
| Asians | 40.8 /100 | #180 | Average 4.9% |
| Hungarians | 40.6 /100 | #181 | Average 4.9% |
| Sri Lankans | 39.8 /100 | #182 | Fair 4.9% |
| Sub-Saharan Africans | 38.9 /100 | #183 | Fair 4.9% |
| Immigrants | Ukraine | 37.6 /100 | #184 | Fair 4.9% |
| Ute | 37.4 /100 | #185 | Fair 4.9% |
| Spaniards | 35.8 /100 | #186 | Fair 4.9% |
| South American Indians | 31.2 /100 | #187 | Fair 4.9% |
| Nicaraguans | 30.4 /100 | #188 | Fair 4.9% |
| Immigrants | Nicaragua | 29.8 /100 | #189 | Fair 4.9% |
| Immigrants | Europe | 29.8 /100 | #190 | Fair 4.9% |
| Immigrants | Nigeria | 29.6 /100 | #191 | Fair 4.9% |
| Menominee | 28.8 /100 | #192 | Fair 4.9% |
| Houma | 28.3 /100 | #193 | Fair 4.9% |
| Immigrants | Colombia | 26.8 /100 | #194 | Fair 4.9% |
| Immigrants | Austria | 26.6 /100 | #195 | Fair 4.9% |
| Immigrants | Asia | 25.7 /100 | #196 | Fair 4.9% |
| Immigrants | Eastern Europe | 25.2 /100 | #197 | Fair 4.9% |
| Guamanians/Chamorros | 23.7 /100 | #198 | Fair 4.9% |
| Immigrants | Vietnam | 23.7 /100 | #199 | Fair 4.9% |
| Immigrants | Czechoslovakia | 23.5 /100 | #200 | Fair 4.9% |