Guamanian/Chamorro vs Argentinean 4th Grade
COMPARE
Guamanian/Chamorro
Argentinean
4th Grade
4th Grade Comparison
Guamanians/Chamorros
Argentineans
97.4%
4TH GRADE
23.0/ 100
METRIC RATING
198th/ 347
METRIC RANK
97.5%
4TH GRADE
39.0/ 100
METRIC RATING
183rd/ 347
METRIC RANK
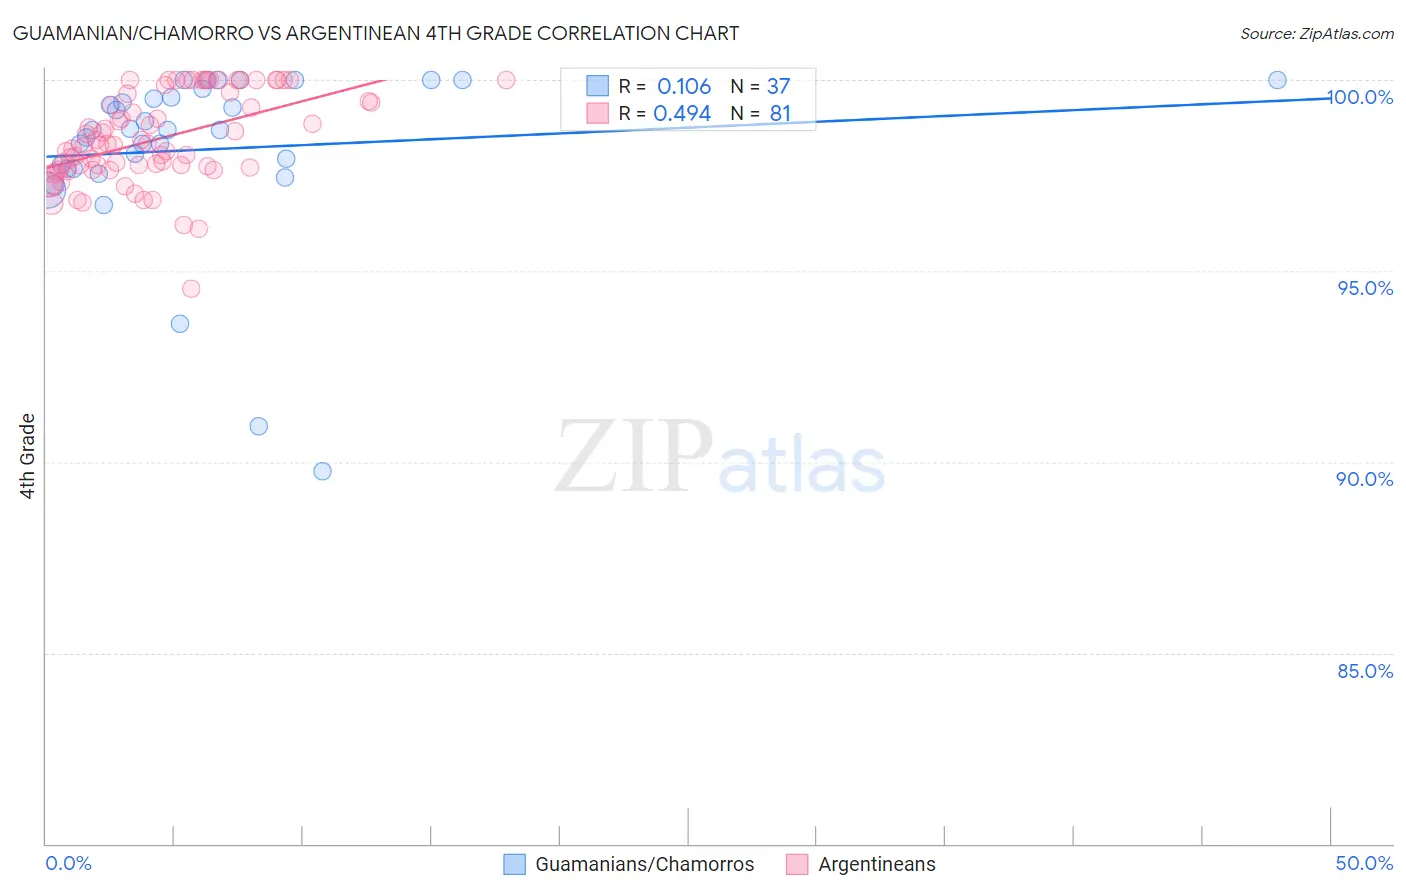
Guamanian/Chamorro vs Argentinean 4th Grade Correlation Chart
The statistical analysis conducted on geographies consisting of 221,965,618 people shows a poor positive correlation between the proportion of Guamanians/Chamorros and percentage of population with at least 4th grade education in the United States with a correlation coefficient (R) of 0.106 and weighted average of 97.4%. Similarly, the statistical analysis conducted on geographies consisting of 297,143,222 people shows a moderate positive correlation between the proportion of Argentineans and percentage of population with at least 4th grade education in the United States with a correlation coefficient (R) of 0.494 and weighted average of 97.5%, a difference of 0.070%.
4th Grade Correlation Summary
| Measurement | Guamanian/Chamorro | Argentinean |
| Minimum | 89.7% | 94.5% |
| Maximum | 100.0% | 100.0% |
| Range | 10.3% | 5.5% |
| Mean | 98.2% | 98.5% |
| Median | 98.7% | 98.3% |
| Interquartile 25% (IQ1) | 97.7% | 97.7% |
| Interquartile 75% (IQ3) | 99.6% | 99.7% |
| Interquartile Range (IQR) | 2.0% | 2.0% |
| Standard Deviation (Sample) | 2.3% | 1.2% |
| Standard Deviation (Population) | 2.3% | 1.2% |
Demographics Similar to Guamanians/Chamorros and Argentineans by 4th Grade
In terms of 4th grade, the demographic groups most similar to Guamanians/Chamorros are Hawaiian (97.4%, a difference of 0.010%), Native/Alaskan (97.4%, a difference of 0.010%), Immigrants from Albania (97.4%, a difference of 0.020%), Immigrants from Uganda (97.4%, a difference of 0.020%), and Immigrants from Ukraine (97.4%, a difference of 0.030%). Similarly, the demographic groups most similar to Argentineans are Spanish American (97.5%, a difference of 0.0%), Immigrants from Venezuela (97.5%, a difference of 0.010%), Immigrants from Taiwan (97.5%, a difference of 0.010%), Pakistani (97.5%, a difference of 0.010%), and Immigrants from Kenya (97.5%, a difference of 0.010%).
| Demographics | Rating | Rank | 4th Grade |
| Immigrants | Venezuela | 42.7 /100 | #180 | Average 97.5% |
| Immigrants | Taiwan | 41.5 /100 | #181 | Average 97.5% |
| Spanish Americans | 39.3 /100 | #182 | Fair 97.5% |
| Argentineans | 39.0 /100 | #183 | Fair 97.5% |
| Pakistanis | 36.2 /100 | #184 | Fair 97.5% |
| Immigrants | Kenya | 35.8 /100 | #185 | Fair 97.5% |
| Dutch West Indians | 35.8 /100 | #186 | Fair 97.5% |
| Mongolians | 34.7 /100 | #187 | Fair 97.5% |
| Immigrants | Argentina | 34.6 /100 | #188 | Fair 97.5% |
| Panamanians | 31.9 /100 | #189 | Fair 97.4% |
| Blacks/African Americans | 31.1 /100 | #190 | Fair 97.4% |
| Navajo | 30.7 /100 | #191 | Fair 97.4% |
| Immigrants | Ukraine | 30.1 /100 | #192 | Fair 97.4% |
| Immigrants | Egypt | 30.1 /100 | #193 | Fair 97.4% |
| Portuguese | 29.2 /100 | #194 | Fair 97.4% |
| Paraguayans | 28.9 /100 | #195 | Fair 97.4% |
| Immigrants | Albania | 27.7 /100 | #196 | Fair 97.4% |
| Hawaiians | 25.6 /100 | #197 | Fair 97.4% |
| Guamanians/Chamorros | 23.0 /100 | #198 | Fair 97.4% |
| Natives/Alaskans | 20.6 /100 | #199 | Fair 97.4% |
| Immigrants | Uganda | 19.8 /100 | #200 | Poor 97.4% |