Puget Sound Salish vs Latvian Unemployment Among Ages 30 to 34 years
COMPARE
Puget Sound Salish
Latvian
Unemployment Among Ages 30 to 34 years
Unemployment Among Ages 30 to 34 years Comparison
Puget Sound Salish
Latvians
5.1%
UNEMPLOYMENT AMONG AGES 30 TO 34 YEARS
98.2/ 100
METRIC RATING
50th/ 347
METRIC RANK
5.0%
UNEMPLOYMENT AMONG AGES 30 TO 34 YEARS
99.3/ 100
METRIC RATING
34th/ 347
METRIC RANK
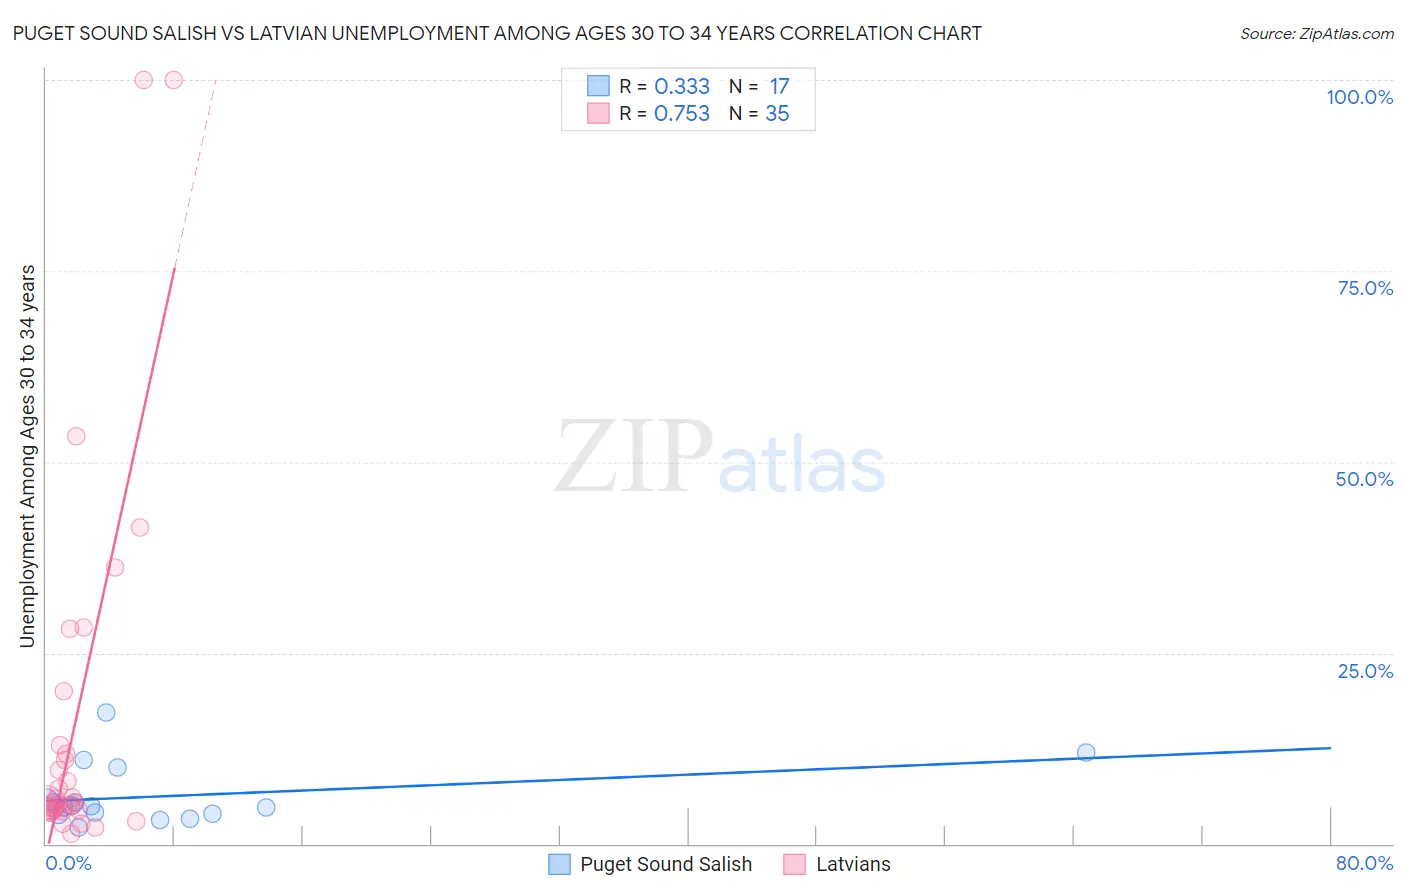
Puget Sound Salish vs Latvian Unemployment Among Ages 30 to 34 years Correlation Chart
The statistical analysis conducted on geographies consisting of 45,325,090 people shows a mild positive correlation between the proportion of Puget Sound Salish and unemployment rate among population between the ages 30 and 34 in the United States with a correlation coefficient (R) of 0.333 and weighted average of 5.1%. Similarly, the statistical analysis conducted on geographies consisting of 211,593,326 people shows a strong positive correlation between the proportion of Latvians and unemployment rate among population between the ages 30 and 34 in the United States with a correlation coefficient (R) of 0.753 and weighted average of 5.0%, a difference of 1.7%.
Unemployment Among Ages 30 to 34 years Correlation Summary
| Measurement | Puget Sound Salish | Latvian |
| Minimum | 2.1% | 1.2% |
| Maximum | 17.2% | 100.0% |
| Range | 15.1% | 98.8% |
| Mean | 6.2% | 15.9% |
| Median | 4.9% | 5.2% |
| Interquartile 25% (IQ1) | 3.9% | 4.4% |
| Interquartile 75% (IQ3) | 7.9% | 12.9% |
| Interquartile Range (IQR) | 4.0% | 8.4% |
| Standard Deviation (Sample) | 4.0% | 24.3% |
| Standard Deviation (Population) | 3.8% | 23.9% |
Demographics Similar to Puget Sound Salish and Latvians by Unemployment Among Ages 30 to 34 years
In terms of unemployment among ages 30 to 34 years, the demographic groups most similar to Puget Sound Salish are Turkish (5.1%, a difference of 0.030%), Immigrants from Burma/Myanmar (5.1%, a difference of 0.070%), Immigrants from Malaysia (5.1%, a difference of 0.080%), Assyrian/Chaldean/Syriac (5.1%, a difference of 0.20%), and Cypriot (5.1%, a difference of 0.21%). Similarly, the demographic groups most similar to Latvians are Immigrants from Saudi Arabia (5.0%, a difference of 0.050%), Immigrants from Zaire (5.0%, a difference of 0.14%), Immigrants from Ethiopia (5.0%, a difference of 0.23%), Czech (5.0%, a difference of 0.28%), and Immigrants from Turkey (5.0%, a difference of 0.53%).
| Demographics | Rating | Rank | Unemployment Among Ages 30 to 34 years |
| Immigrants | Zaire | 99.3 /100 | #32 | Exceptional 5.0% |
| Immigrants | Saudi Arabia | 99.3 /100 | #33 | Exceptional 5.0% |
| Latvians | 99.3 /100 | #34 | Exceptional 5.0% |
| Immigrants | Ethiopia | 99.2 /100 | #35 | Exceptional 5.0% |
| Czechs | 99.2 /100 | #36 | Exceptional 5.0% |
| Immigrants | Turkey | 99.0 /100 | #37 | Exceptional 5.0% |
| Sri Lankans | 99.0 /100 | #38 | Exceptional 5.0% |
| Fijians | 99.0 /100 | #39 | Exceptional 5.0% |
| Immigrants | Vietnam | 98.9 /100 | #40 | Exceptional 5.0% |
| Immigrants | Eastern Africa | 98.9 /100 | #41 | Exceptional 5.0% |
| Immigrants | Hong Kong | 98.8 /100 | #42 | Exceptional 5.0% |
| Soviet Union | 98.8 /100 | #43 | Exceptional 5.0% |
| Immigrants | Belgium | 98.7 /100 | #44 | Exceptional 5.1% |
| Yugoslavians | 98.6 /100 | #45 | Exceptional 5.1% |
| Immigrants | Congo | 98.4 /100 | #46 | Exceptional 5.1% |
| Cypriots | 98.4 /100 | #47 | Exceptional 5.1% |
| Assyrians/Chaldeans/Syriacs | 98.4 /100 | #48 | Exceptional 5.1% |
| Immigrants | Malaysia | 98.3 /100 | #49 | Exceptional 5.1% |
| Puget Sound Salish | 98.2 /100 | #50 | Exceptional 5.1% |
| Turks | 98.2 /100 | #51 | Exceptional 5.1% |
| Immigrants | Burma/Myanmar | 98.1 /100 | #52 | Exceptional 5.1% |