German vs Filipino Unemployment Among Ages 30 to 34 years
COMPARE
German
Filipino
Unemployment Among Ages 30 to 34 years
Unemployment Among Ages 30 to 34 years Comparison
Germans
Filipinos
5.3%
UNEMPLOYMENT AMONG AGES 30 TO 34 YEARS
77.8/ 100
METRIC RATING
130th/ 347
METRIC RANK
4.8%
UNEMPLOYMENT AMONG AGES 30 TO 34 YEARS
99.9/ 100
METRIC RATING
12th/ 347
METRIC RANK
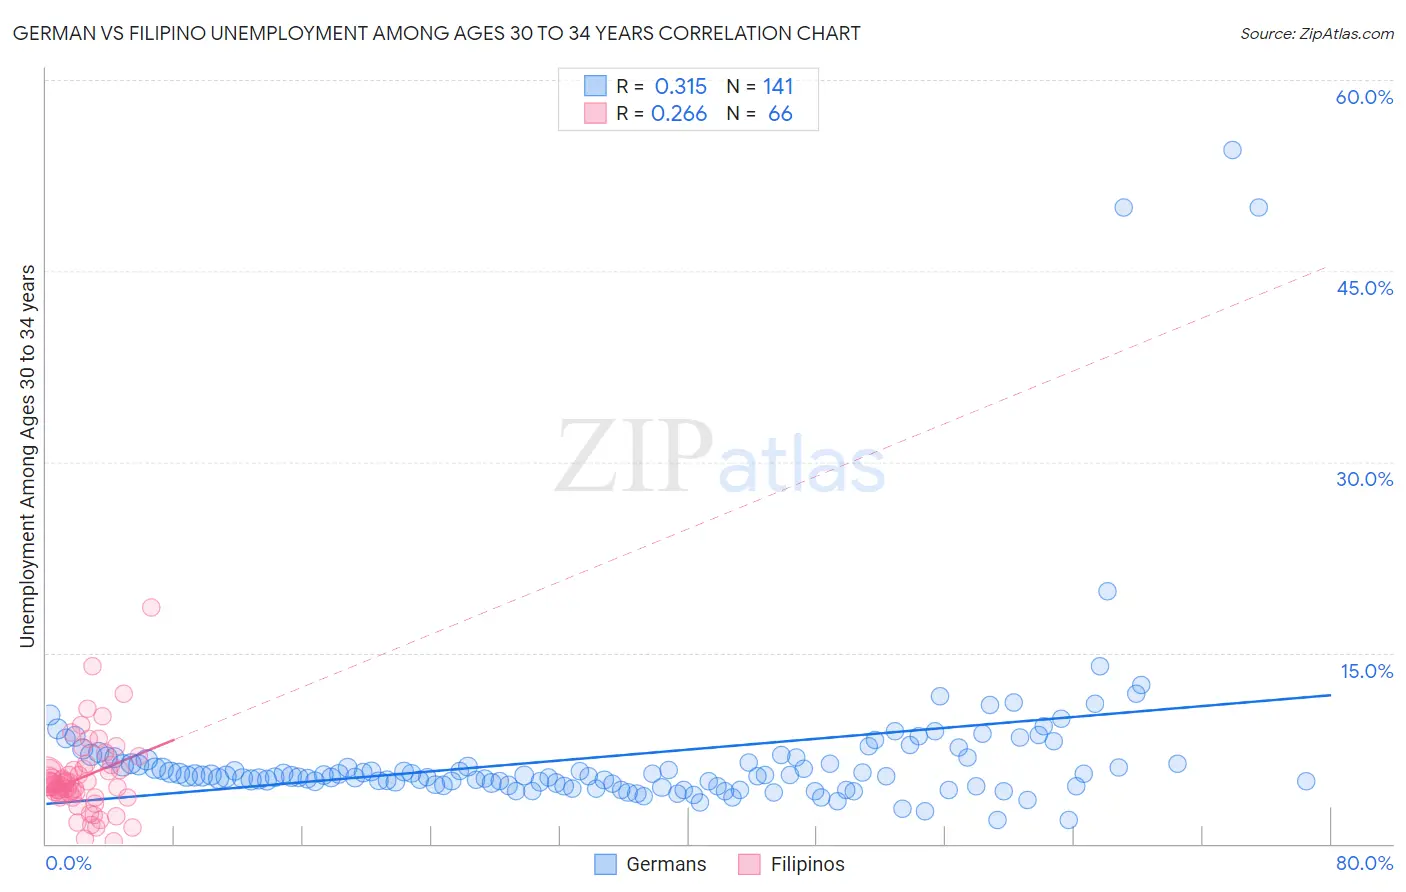
German vs Filipino Unemployment Among Ages 30 to 34 years Correlation Chart
The statistical analysis conducted on geographies consisting of 502,645,862 people shows a mild positive correlation between the proportion of Germans and unemployment rate among population between the ages 30 and 34 in the United States with a correlation coefficient (R) of 0.315 and weighted average of 5.3%. Similarly, the statistical analysis conducted on geographies consisting of 245,104,087 people shows a weak positive correlation between the proportion of Filipinos and unemployment rate among population between the ages 30 and 34 in the United States with a correlation coefficient (R) of 0.266 and weighted average of 4.8%, a difference of 11.1%.
Unemployment Among Ages 30 to 34 years Correlation Summary
| Measurement | German | Filipino |
| Minimum | 1.9% | 0.20% |
| Maximum | 54.5% | 18.6% |
| Range | 52.6% | 18.4% |
| Mean | 6.9% | 5.2% |
| Median | 5.3% | 4.7% |
| Interquartile 25% (IQ1) | 4.6% | 3.9% |
| Interquartile 75% (IQ3) | 6.8% | 5.8% |
| Interquartile Range (IQR) | 2.2% | 1.9% |
| Standard Deviation (Sample) | 7.0% | 3.0% |
| Standard Deviation (Population) | 7.0% | 3.0% |
Similar Demographics by Unemployment Among Ages 30 to 34 years
Demographics Similar to Germans by Unemployment Among Ages 30 to 34 years
In terms of unemployment among ages 30 to 34 years, the demographic groups most similar to Germans are Immigrants from Eastern Europe (5.3%, a difference of 0.040%), Carpatho Rusyn (5.3%, a difference of 0.050%), Immigrants from Northern Europe (5.3%, a difference of 0.050%), Polish (5.3%, a difference of 0.10%), and Bangladeshi (5.3%, a difference of 0.12%).
| Demographics | Rating | Rank | Unemployment Among Ages 30 to 34 years |
| Immigrants | Italy | 81.1 /100 | #123 | Excellent 5.3% |
| Immigrants | Brazil | 80.8 /100 | #124 | Excellent 5.3% |
| Greeks | 80.4 /100 | #125 | Excellent 5.3% |
| Immigrants | Sri Lanka | 80.2 /100 | #126 | Excellent 5.3% |
| Taiwanese | 79.4 /100 | #127 | Good 5.3% |
| Immigrants | Uruguay | 79.3 /100 | #128 | Good 5.3% |
| Poles | 78.8 /100 | #129 | Good 5.3% |
| Germans | 77.8 /100 | #130 | Good 5.3% |
| Immigrants | Eastern Europe | 77.4 /100 | #131 | Good 5.3% |
| Carpatho Rusyns | 77.3 /100 | #132 | Good 5.3% |
| Immigrants | Northern Europe | 77.3 /100 | #133 | Good 5.3% |
| Bangladeshis | 76.6 /100 | #134 | Good 5.3% |
| Palestinians | 75.1 /100 | #135 | Good 5.4% |
| Pakistanis | 74.6 /100 | #136 | Good 5.4% |
| Immigrants | Canada | 74.6 /100 | #137 | Good 5.4% |
Demographics Similar to Filipinos by Unemployment Among Ages 30 to 34 years
In terms of unemployment among ages 30 to 34 years, the demographic groups most similar to Filipinos are Cambodian (4.8%, a difference of 0.0%), Luxembourger (4.8%, a difference of 0.010%), Okinawan (4.8%, a difference of 0.39%), Zimbabwean (4.8%, a difference of 0.49%), and Immigrants from Bulgaria (4.8%, a difference of 0.60%).
| Demographics | Rating | Rank | Unemployment Among Ages 30 to 34 years |
| Venezuelans | 100.0 /100 | #5 | Exceptional 4.7% |
| Immigrants | Bosnia and Herzegovina | 100.0 /100 | #6 | Exceptional 4.7% |
| Thais | 100.0 /100 | #7 | Exceptional 4.7% |
| Immigrants | Eritrea | 100.0 /100 | #8 | Exceptional 4.7% |
| Bulgarians | 99.9 /100 | #9 | Exceptional 4.7% |
| Tongans | 99.9 /100 | #10 | Exceptional 4.8% |
| Immigrants | Bolivia | 99.9 /100 | #11 | Exceptional 4.8% |
| Filipinos | 99.9 /100 | #12 | Exceptional 4.8% |
| Cambodians | 99.9 /100 | #13 | Exceptional 4.8% |
| Luxembourgers | 99.9 /100 | #14 | Exceptional 4.8% |
| Okinawans | 99.9 /100 | #15 | Exceptional 4.8% |
| Zimbabweans | 99.9 /100 | #16 | Exceptional 4.8% |
| Immigrants | Bulgaria | 99.9 /100 | #17 | Exceptional 4.8% |
| Bolivians | 99.8 /100 | #18 | Exceptional 4.9% |
| Immigrants | Sudan | 99.8 /100 | #19 | Exceptional 4.9% |