German vs Immigrants from Dominican Republic Unemployment Among Women with Children Under 6 years
COMPARE
German
Immigrants from Dominican Republic
Unemployment Among Women with Children Under 6 years
Unemployment Among Women with Children Under 6 years Comparison
Germans
Immigrants from Dominican Republic
8.0%
UNEMPLOYMENT AMONG WOMEN WITH CHILDREN UNDER 6 YEARS
7.0/ 100
METRIC RATING
225th/ 347
METRIC RANK
8.9%
UNEMPLOYMENT AMONG WOMEN WITH CHILDREN UNDER 6 YEARS
0.0/ 100
METRIC RATING
296th/ 347
METRIC RANK
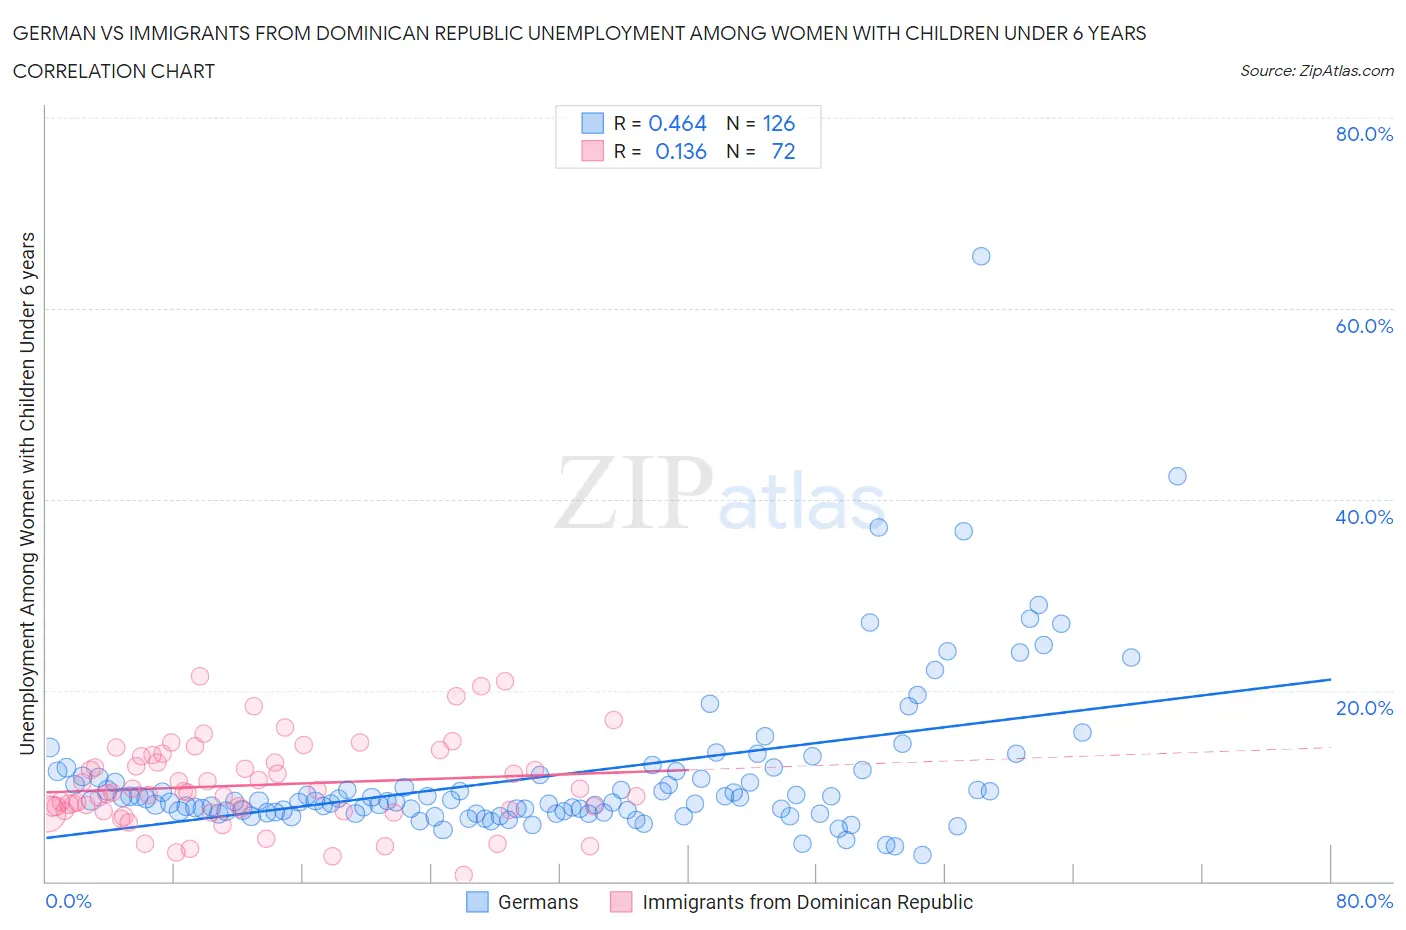
German vs Immigrants from Dominican Republic Unemployment Among Women with Children Under 6 years Correlation Chart
The statistical analysis conducted on geographies consisting of 379,455,482 people shows a moderate positive correlation between the proportion of Germans and unemployment rate among women with children under the age of 6 in the United States with a correlation coefficient (R) of 0.464 and weighted average of 8.0%. Similarly, the statistical analysis conducted on geographies consisting of 221,187,094 people shows a poor positive correlation between the proportion of Immigrants from Dominican Republic and unemployment rate among women with children under the age of 6 in the United States with a correlation coefficient (R) of 0.136 and weighted average of 8.9%, a difference of 11.2%.
Unemployment Among Women with Children Under 6 years Correlation Summary
| Measurement | German | Immigrants from Dominican Republic |
| Minimum | 2.7% | 0.60% |
| Maximum | 65.5% | 21.5% |
| Range | 62.8% | 20.9% |
| Mean | 11.1% | 10.1% |
| Median | 8.4% | 9.3% |
| Interquartile 25% (IQ1) | 7.3% | 7.4% |
| Interquartile 75% (IQ3) | 11.0% | 12.8% |
| Interquartile Range (IQR) | 3.7% | 5.4% |
| Standard Deviation (Sample) | 8.3% | 4.4% |
| Standard Deviation (Population) | 8.3% | 4.4% |
Similar Demographics by Unemployment Among Women with Children Under 6 years
Demographics Similar to Germans by Unemployment Among Women with Children Under 6 years
In terms of unemployment among women with children under 6 years, the demographic groups most similar to Germans are English (8.0%, a difference of 0.030%), Carpatho Rusyn (8.0%, a difference of 0.17%), Senegalese (8.0%, a difference of 0.22%), Portuguese (8.0%, a difference of 0.22%), and Immigrants from Sudan (8.0%, a difference of 0.26%).
| Demographics | Rating | Rank | Unemployment Among Women with Children Under 6 years |
| Moroccans | 9.7 /100 | #218 | Tragic 7.9% |
| Arabs | 9.4 /100 | #219 | Tragic 7.9% |
| South American Indians | 9.3 /100 | #220 | Tragic 7.9% |
| Immigrants | Germany | 8.5 /100 | #221 | Tragic 7.9% |
| Samoans | 8.4 /100 | #222 | Tragic 7.9% |
| Carpatho Rusyns | 7.8 /100 | #223 | Tragic 8.0% |
| English | 7.2 /100 | #224 | Tragic 8.0% |
| Germans | 7.0 /100 | #225 | Tragic 8.0% |
| Senegalese | 6.2 /100 | #226 | Tragic 8.0% |
| Portuguese | 6.2 /100 | #227 | Tragic 8.0% |
| Immigrants | Sudan | 6.0 /100 | #228 | Tragic 8.0% |
| Salvadorans | 5.5 /100 | #229 | Tragic 8.0% |
| Finns | 5.3 /100 | #230 | Tragic 8.0% |
| Trinidadians and Tobagonians | 5.3 /100 | #231 | Tragic 8.0% |
| Welsh | 5.0 /100 | #232 | Tragic 8.0% |
Demographics Similar to Immigrants from Dominican Republic by Unemployment Among Women with Children Under 6 years
In terms of unemployment among women with children under 6 years, the demographic groups most similar to Immigrants from Dominican Republic are Mexican (8.9%, a difference of 0.10%), Immigrants from Central America (8.9%, a difference of 0.13%), Nonimmigrants (8.8%, a difference of 0.18%), Tlingit-Haida (8.9%, a difference of 0.25%), and Immigrants from Bangladesh (8.8%, a difference of 0.36%).
| Demographics | Rating | Rank | Unemployment Among Women with Children Under 6 years |
| Iroquois | 0.0 /100 | #289 | Tragic 8.7% |
| Vietnamese | 0.0 /100 | #290 | Tragic 8.8% |
| Jamaicans | 0.0 /100 | #291 | Tragic 8.8% |
| Cheyenne | 0.0 /100 | #292 | Tragic 8.8% |
| Immigrants | Bangladesh | 0.0 /100 | #293 | Tragic 8.8% |
| Immigrants | Nonimmigrants | 0.0 /100 | #294 | Tragic 8.8% |
| Immigrants | Central America | 0.0 /100 | #295 | Tragic 8.9% |
| Immigrants | Dominican Republic | 0.0 /100 | #296 | Tragic 8.9% |
| Mexicans | 0.0 /100 | #297 | Tragic 8.9% |
| Tlingit-Haida | 0.0 /100 | #298 | Tragic 8.9% |
| Immigrants | Jamaica | 0.0 /100 | #299 | Tragic 8.9% |
| Creek | 0.0 /100 | #300 | Tragic 8.9% |
| Chickasaw | 0.0 /100 | #301 | Tragic 9.0% |
| Hispanics or Latinos | 0.0 /100 | #302 | Tragic 9.0% |
| Immigrants | West Indies | 0.0 /100 | #303 | Tragic 9.0% |