German vs Immigrants from Dominican Republic Family Households
COMPARE
German
Immigrants from Dominican Republic
Family Households
Family Households Comparison
Germans
Immigrants from Dominican Republic
64.4%
FAMILY HOUSEHOLDS
65.8/ 100
METRIC RATING
159th/ 347
METRIC RANK
63.3%
FAMILY HOUSEHOLDS
1.0/ 100
METRIC RATING
253rd/ 347
METRIC RANK
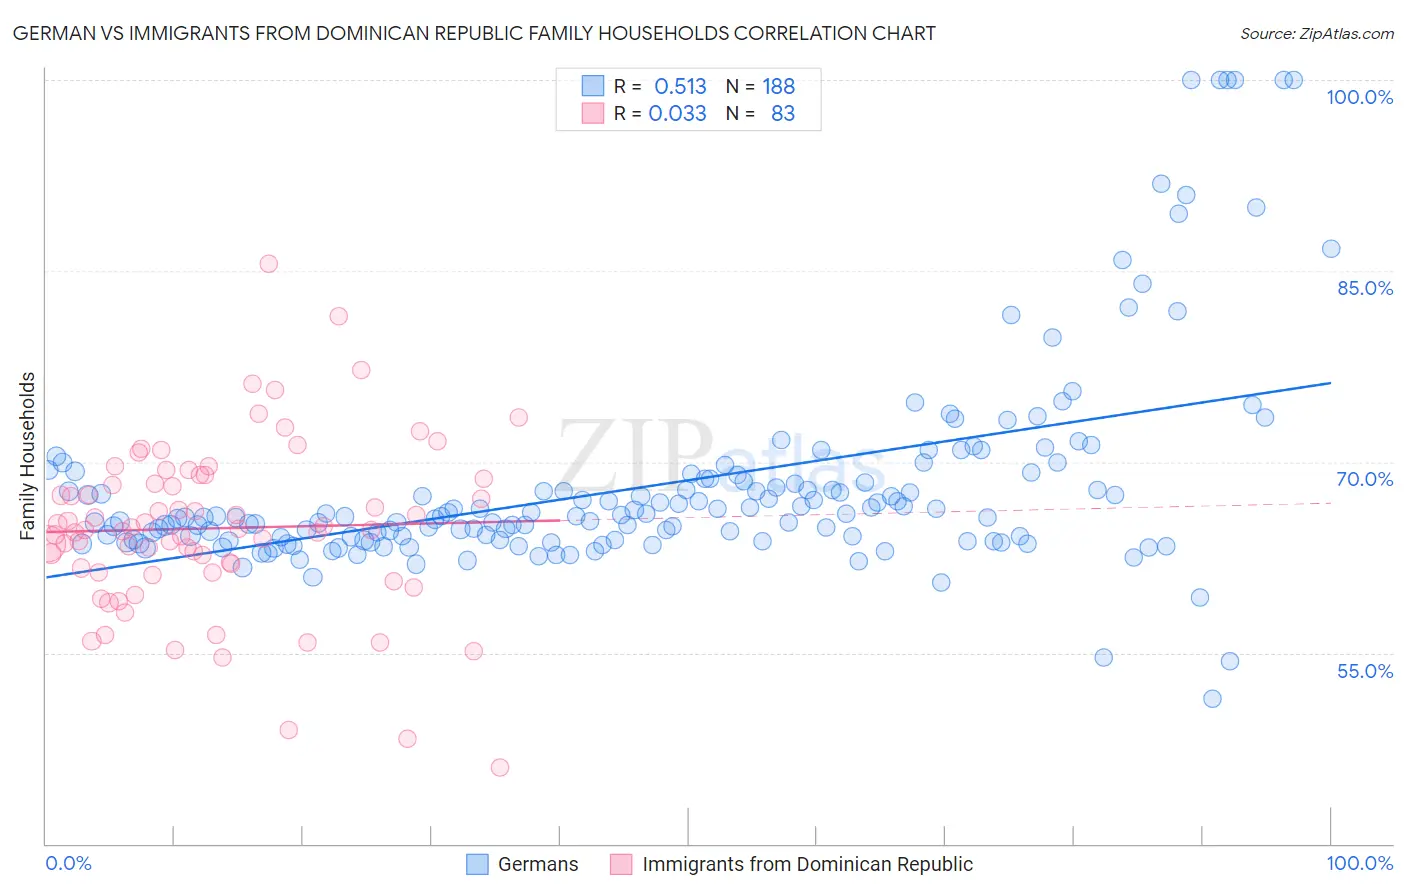
German vs Immigrants from Dominican Republic Family Households Correlation Chart
The statistical analysis conducted on geographies consisting of 580,609,417 people shows a substantial positive correlation between the proportion of Germans and percentage of family households in the United States with a correlation coefficient (R) of 0.513 and weighted average of 64.4%. Similarly, the statistical analysis conducted on geographies consisting of 274,978,425 people shows no correlation between the proportion of Immigrants from Dominican Republic and percentage of family households in the United States with a correlation coefficient (R) of 0.033 and weighted average of 63.3%, a difference of 1.8%.
Family Households Correlation Summary
| Measurement | German | Immigrants from Dominican Republic |
| Minimum | 51.4% | 46.0% |
| Maximum | 100.0% | 85.5% |
| Range | 48.6% | 39.6% |
| Mean | 68.1% | 64.8% |
| Median | 65.7% | 64.7% |
| Interquartile 25% (IQ1) | 63.9% | 61.3% |
| Interquartile 75% (IQ3) | 68.5% | 68.7% |
| Interquartile Range (IQR) | 4.7% | 7.4% |
| Standard Deviation (Sample) | 8.2% | 6.7% |
| Standard Deviation (Population) | 8.2% | 6.6% |
Similar Demographics by Family Households
Demographics Similar to Germans by Family Households
In terms of family households, the demographic groups most similar to Germans are Canadian (64.4%, a difference of 0.010%), Lebanese (64.4%, a difference of 0.010%), Immigrants from Moldova (64.4%, a difference of 0.010%), Czech (64.5%, a difference of 0.020%), and Uruguayan (64.5%, a difference of 0.030%).
| Demographics | Rating | Rank | Family Households |
| Scottish | 70.9 /100 | #152 | Good 64.5% |
| Swedes | 69.8 /100 | #153 | Good 64.5% |
| Austrians | 68.5 /100 | #154 | Good 64.5% |
| Uruguayans | 67.7 /100 | #155 | Good 64.5% |
| Czechs | 67.0 /100 | #156 | Good 64.5% |
| Canadians | 66.6 /100 | #157 | Good 64.4% |
| Lebanese | 66.4 /100 | #158 | Good 64.4% |
| Germans | 65.8 /100 | #159 | Good 64.4% |
| Immigrants | Moldova | 65.2 /100 | #160 | Good 64.4% |
| Immigrants | England | 62.6 /100 | #161 | Good 64.4% |
| British | 61.6 /100 | #162 | Good 64.4% |
| Chickasaw | 61.5 /100 | #163 | Good 64.4% |
| Immigrants | Nigeria | 60.1 /100 | #164 | Good 64.4% |
| Immigrants | Southern Europe | 60.0 /100 | #165 | Good 64.4% |
| Scotch-Irish | 59.2 /100 | #166 | Average 64.4% |
Demographics Similar to Immigrants from Dominican Republic by Family Households
In terms of family households, the demographic groups most similar to Immigrants from Dominican Republic are Slovak (63.3%, a difference of 0.010%), Bahamian (63.3%, a difference of 0.020%), Potawatomi (63.3%, a difference of 0.030%), Taiwanese (63.3%, a difference of 0.040%), and Luxembourger (63.3%, a difference of 0.050%).
| Demographics | Rating | Rank | Family Households |
| Immigrants | Ghana | 1.6 /100 | #246 | Tragic 63.4% |
| Immigrants | Uzbekistan | 1.5 /100 | #247 | Tragic 63.4% |
| Dominicans | 1.5 /100 | #248 | Tragic 63.4% |
| Russians | 1.4 /100 | #249 | Tragic 63.4% |
| Immigrants | Japan | 1.4 /100 | #250 | Tragic 63.4% |
| Taiwanese | 1.2 /100 | #251 | Tragic 63.3% |
| Bahamians | 1.1 /100 | #252 | Tragic 63.3% |
| Immigrants | Dominican Republic | 1.0 /100 | #253 | Tragic 63.3% |
| Slovaks | 1.0 /100 | #254 | Tragic 63.3% |
| Potawatomi | 1.0 /100 | #255 | Tragic 63.3% |
| Luxembourgers | 0.9 /100 | #256 | Tragic 63.3% |
| Icelanders | 0.8 /100 | #257 | Tragic 63.3% |
| Immigrants | Barbados | 0.7 /100 | #258 | Tragic 63.2% |
| Immigrants | Western Europe | 0.6 /100 | #259 | Tragic 63.2% |
| Cypriots | 0.6 /100 | #260 | Tragic 63.2% |