German vs Immigrants from Afghanistan Unemployment Among Women with Children Under 6 years
COMPARE
German
Immigrants from Afghanistan
Unemployment Among Women with Children Under 6 years
Unemployment Among Women with Children Under 6 years Comparison
Germans
Immigrants from Afghanistan
8.0%
UNEMPLOYMENT AMONG WOMEN WITH CHILDREN UNDER 6 YEARS
7.0/ 100
METRIC RATING
225th/ 347
METRIC RANK
7.1%
UNEMPLOYMENT AMONG WOMEN WITH CHILDREN UNDER 6 YEARS
98.7/ 100
METRIC RATING
82nd/ 347
METRIC RANK
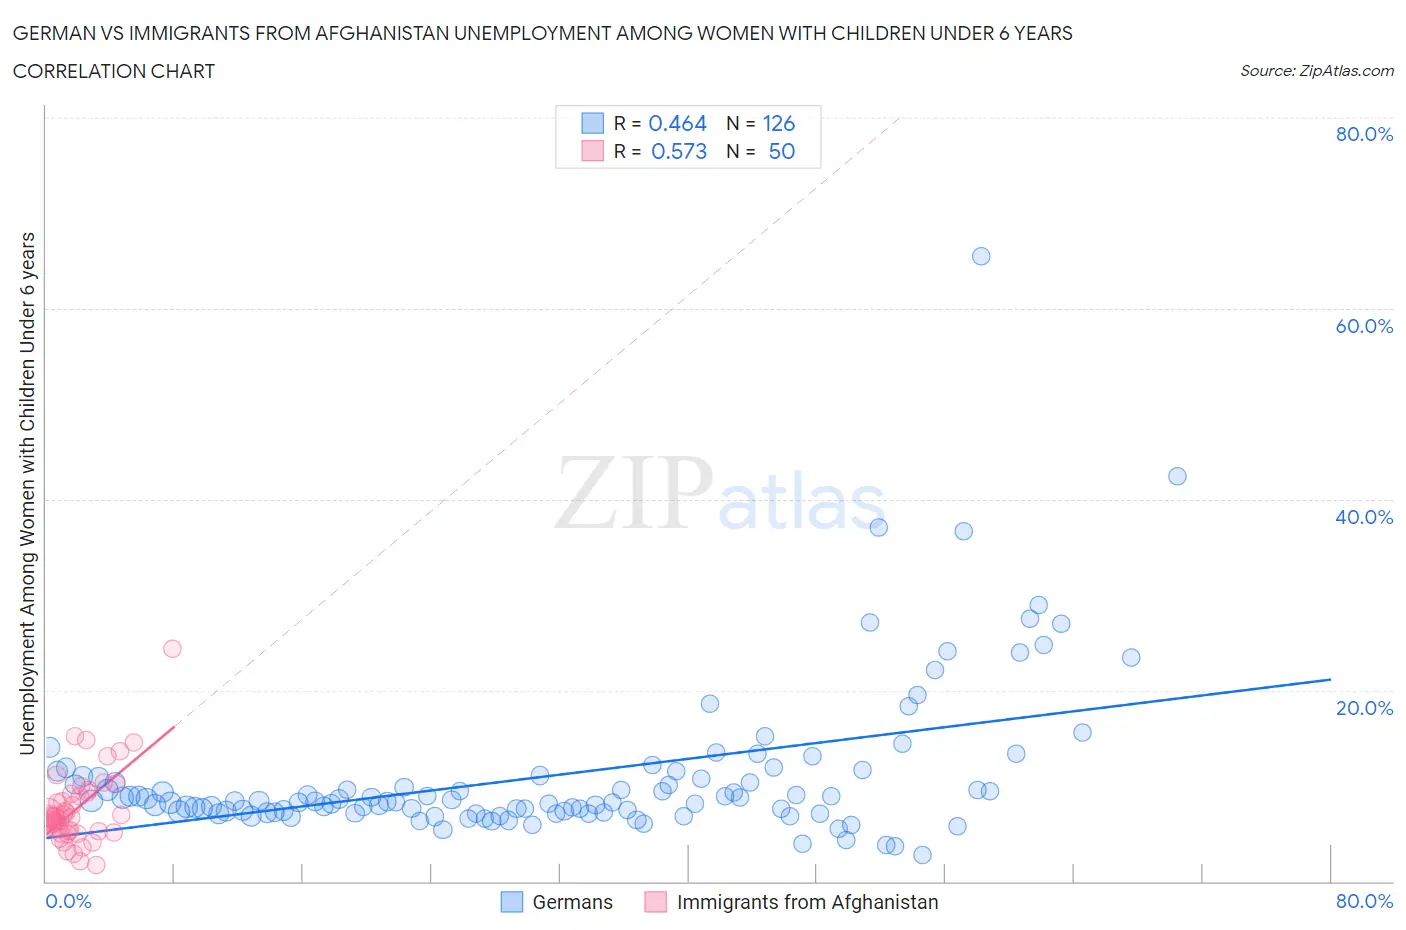
German vs Immigrants from Afghanistan Unemployment Among Women with Children Under 6 years Correlation Chart
The statistical analysis conducted on geographies consisting of 379,455,482 people shows a moderate positive correlation between the proportion of Germans and unemployment rate among women with children under the age of 6 in the United States with a correlation coefficient (R) of 0.464 and weighted average of 8.0%. Similarly, the statistical analysis conducted on geographies consisting of 132,201,739 people shows a substantial positive correlation between the proportion of Immigrants from Afghanistan and unemployment rate among women with children under the age of 6 in the United States with a correlation coefficient (R) of 0.573 and weighted average of 7.1%, a difference of 12.4%.
Unemployment Among Women with Children Under 6 years Correlation Summary
| Measurement | German | Immigrants from Afghanistan |
| Minimum | 2.7% | 1.7% |
| Maximum | 65.5% | 24.4% |
| Range | 62.8% | 22.7% |
| Mean | 11.1% | 7.6% |
| Median | 8.4% | 6.7% |
| Interquartile 25% (IQ1) | 7.3% | 5.3% |
| Interquartile 75% (IQ3) | 11.0% | 9.2% |
| Interquartile Range (IQR) | 3.7% | 3.9% |
| Standard Deviation (Sample) | 8.3% | 4.0% |
| Standard Deviation (Population) | 8.3% | 3.9% |
Similar Demographics by Unemployment Among Women with Children Under 6 years
Demographics Similar to Germans by Unemployment Among Women with Children Under 6 years
In terms of unemployment among women with children under 6 years, the demographic groups most similar to Germans are English (8.0%, a difference of 0.030%), Carpatho Rusyn (8.0%, a difference of 0.17%), Senegalese (8.0%, a difference of 0.22%), Portuguese (8.0%, a difference of 0.22%), and Immigrants from Sudan (8.0%, a difference of 0.26%).
| Demographics | Rating | Rank | Unemployment Among Women with Children Under 6 years |
| Moroccans | 9.7 /100 | #218 | Tragic 7.9% |
| Arabs | 9.4 /100 | #219 | Tragic 7.9% |
| South American Indians | 9.3 /100 | #220 | Tragic 7.9% |
| Immigrants | Germany | 8.5 /100 | #221 | Tragic 7.9% |
| Samoans | 8.4 /100 | #222 | Tragic 7.9% |
| Carpatho Rusyns | 7.8 /100 | #223 | Tragic 8.0% |
| English | 7.2 /100 | #224 | Tragic 8.0% |
| Germans | 7.0 /100 | #225 | Tragic 8.0% |
| Senegalese | 6.2 /100 | #226 | Tragic 8.0% |
| Portuguese | 6.2 /100 | #227 | Tragic 8.0% |
| Immigrants | Sudan | 6.0 /100 | #228 | Tragic 8.0% |
| Salvadorans | 5.5 /100 | #229 | Tragic 8.0% |
| Finns | 5.3 /100 | #230 | Tragic 8.0% |
| Trinidadians and Tobagonians | 5.3 /100 | #231 | Tragic 8.0% |
| Welsh | 5.0 /100 | #232 | Tragic 8.0% |
Demographics Similar to Immigrants from Afghanistan by Unemployment Among Women with Children Under 6 years
In terms of unemployment among women with children under 6 years, the demographic groups most similar to Immigrants from Afghanistan are Egyptian (7.1%, a difference of 0.030%), Immigrants from Albania (7.1%, a difference of 0.080%), Immigrants from Romania (7.1%, a difference of 0.12%), Immigrants from Venezuela (7.1%, a difference of 0.15%), and Immigrants from Greece (7.1%, a difference of 0.19%).
| Demographics | Rating | Rank | Unemployment Among Women with Children Under 6 years |
| Immigrants | Eastern Europe | 99.0 /100 | #75 | Exceptional 7.1% |
| Estonians | 99.0 /100 | #76 | Exceptional 7.1% |
| Immigrants | Croatia | 98.9 /100 | #77 | Exceptional 7.1% |
| Immigrants | Somalia | 98.9 /100 | #78 | Exceptional 7.1% |
| Immigrants | Fiji | 98.9 /100 | #79 | Exceptional 7.1% |
| Immigrants | Greece | 98.9 /100 | #80 | Exceptional 7.1% |
| Immigrants | Venezuela | 98.8 /100 | #81 | Exceptional 7.1% |
| Immigrants | Afghanistan | 98.7 /100 | #82 | Exceptional 7.1% |
| Egyptians | 98.7 /100 | #83 | Exceptional 7.1% |
| Immigrants | Albania | 98.7 /100 | #84 | Exceptional 7.1% |
| Immigrants | Romania | 98.7 /100 | #85 | Exceptional 7.1% |
| Immigrants | Zimbabwe | 98.6 /100 | #86 | Exceptional 7.1% |
| Alsatians | 98.4 /100 | #87 | Exceptional 7.1% |
| Immigrants | Hungary | 98.3 /100 | #88 | Exceptional 7.1% |
| Immigrants | Denmark | 98.3 /100 | #89 | Exceptional 7.1% |