German vs Immigrants from Indonesia Unemployment Among Women with Children Under 6 years
COMPARE
German
Immigrants from Indonesia
Unemployment Among Women with Children Under 6 years
Unemployment Among Women with Children Under 6 years Comparison
Germans
Immigrants from Indonesia
8.0%
UNEMPLOYMENT AMONG WOMEN WITH CHILDREN UNDER 6 YEARS
7.0/ 100
METRIC RATING
225th/ 347
METRIC RANK
6.7%
UNEMPLOYMENT AMONG WOMEN WITH CHILDREN UNDER 6 YEARS
99.9/ 100
METRIC RATING
41st/ 347
METRIC RANK
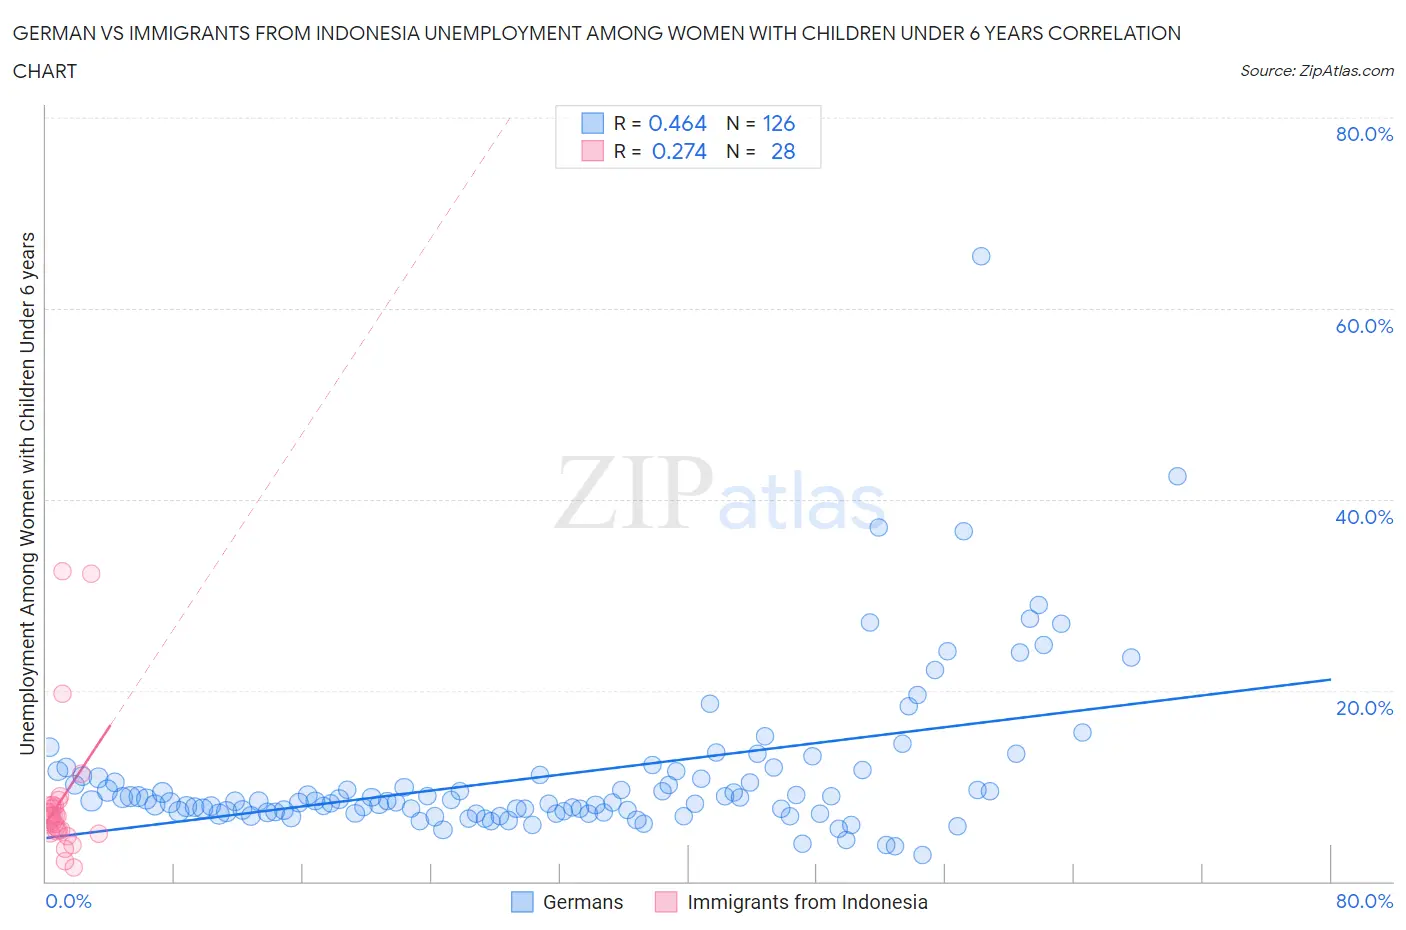
German vs Immigrants from Indonesia Unemployment Among Women with Children Under 6 years Correlation Chart
The statistical analysis conducted on geographies consisting of 379,455,482 people shows a moderate positive correlation between the proportion of Germans and unemployment rate among women with children under the age of 6 in the United States with a correlation coefficient (R) of 0.464 and weighted average of 8.0%. Similarly, the statistical analysis conducted on geographies consisting of 184,987,749 people shows a weak positive correlation between the proportion of Immigrants from Indonesia and unemployment rate among women with children under the age of 6 in the United States with a correlation coefficient (R) of 0.274 and weighted average of 6.7%, a difference of 19.3%.
Unemployment Among Women with Children Under 6 years Correlation Summary
| Measurement | German | Immigrants from Indonesia |
| Minimum | 2.7% | 1.5% |
| Maximum | 65.5% | 32.5% |
| Range | 62.8% | 31.0% |
| Mean | 11.1% | 8.5% |
| Median | 8.4% | 6.7% |
| Interquartile 25% (IQ1) | 7.3% | 5.2% |
| Interquartile 75% (IQ3) | 11.0% | 7.9% |
| Interquartile Range (IQR) | 3.7% | 2.7% |
| Standard Deviation (Sample) | 8.3% | 7.5% |
| Standard Deviation (Population) | 8.3% | 7.3% |
Similar Demographics by Unemployment Among Women with Children Under 6 years
Demographics Similar to Germans by Unemployment Among Women with Children Under 6 years
In terms of unemployment among women with children under 6 years, the demographic groups most similar to Germans are English (8.0%, a difference of 0.030%), Carpatho Rusyn (8.0%, a difference of 0.17%), Senegalese (8.0%, a difference of 0.22%), Portuguese (8.0%, a difference of 0.22%), and Immigrants from Sudan (8.0%, a difference of 0.26%).
| Demographics | Rating | Rank | Unemployment Among Women with Children Under 6 years |
| Moroccans | 9.7 /100 | #218 | Tragic 7.9% |
| Arabs | 9.4 /100 | #219 | Tragic 7.9% |
| South American Indians | 9.3 /100 | #220 | Tragic 7.9% |
| Immigrants | Germany | 8.5 /100 | #221 | Tragic 7.9% |
| Samoans | 8.4 /100 | #222 | Tragic 7.9% |
| Carpatho Rusyns | 7.8 /100 | #223 | Tragic 8.0% |
| English | 7.2 /100 | #224 | Tragic 8.0% |
| Germans | 7.0 /100 | #225 | Tragic 8.0% |
| Senegalese | 6.2 /100 | #226 | Tragic 8.0% |
| Portuguese | 6.2 /100 | #227 | Tragic 8.0% |
| Immigrants | Sudan | 6.0 /100 | #228 | Tragic 8.0% |
| Salvadorans | 5.5 /100 | #229 | Tragic 8.0% |
| Finns | 5.3 /100 | #230 | Tragic 8.0% |
| Trinidadians and Tobagonians | 5.3 /100 | #231 | Tragic 8.0% |
| Welsh | 5.0 /100 | #232 | Tragic 8.0% |
Demographics Similar to Immigrants from Indonesia by Unemployment Among Women with Children Under 6 years
In terms of unemployment among women with children under 6 years, the demographic groups most similar to Immigrants from Indonesia are Immigrants from Cuba (6.7%, a difference of 0.10%), Asian (6.7%, a difference of 0.16%), Immigrants from Russia (6.7%, a difference of 0.37%), Bhutanese (6.7%, a difference of 0.38%), and Hmong (6.7%, a difference of 0.44%).
| Demographics | Rating | Rank | Unemployment Among Women with Children Under 6 years |
| Immigrants | South Central Asia | 100.0 /100 | #34 | Exceptional 6.6% |
| Yakama | 100.0 /100 | #35 | Exceptional 6.6% |
| Luxembourgers | 100.0 /100 | #36 | Exceptional 6.6% |
| Sri Lankans | 100.0 /100 | #37 | Exceptional 6.6% |
| Hmong | 100.0 /100 | #38 | Exceptional 6.7% |
| Immigrants | Russia | 100.0 /100 | #39 | Exceptional 6.7% |
| Asians | 100.0 /100 | #40 | Exceptional 6.7% |
| Immigrants | Indonesia | 99.9 /100 | #41 | Exceptional 6.7% |
| Immigrants | Cuba | 99.9 /100 | #42 | Exceptional 6.7% |
| Bhutanese | 99.9 /100 | #43 | Exceptional 6.7% |
| Iranians | 99.9 /100 | #44 | Exceptional 6.7% |
| Immigrants | Australia | 99.9 /100 | #45 | Exceptional 6.8% |
| Latvians | 99.9 /100 | #46 | Exceptional 6.8% |
| Immigrants | Asia | 99.9 /100 | #47 | Exceptional 6.8% |
| Immigrants | Switzerland | 99.9 /100 | #48 | Exceptional 6.8% |