Immigrants from Asia vs Immigrants from Dominican Republic Unemployment Among Women with Children Under 6 years
COMPARE
Immigrants from Asia
Immigrants from Dominican Republic
Unemployment Among Women with Children Under 6 years
Unemployment Among Women with Children Under 6 years Comparison
Immigrants from Asia
Immigrants from Dominican Republic
6.8%
UNEMPLOYMENT AMONG WOMEN WITH CHILDREN UNDER 6 YEARS
99.9/ 100
METRIC RATING
47th/ 347
METRIC RANK
8.9%
UNEMPLOYMENT AMONG WOMEN WITH CHILDREN UNDER 6 YEARS
0.0/ 100
METRIC RATING
296th/ 347
METRIC RANK
Immigrants from Asia vs Immigrants from Dominican Republic Unemployment Among Women with Children Under 6 years Correlation Chart
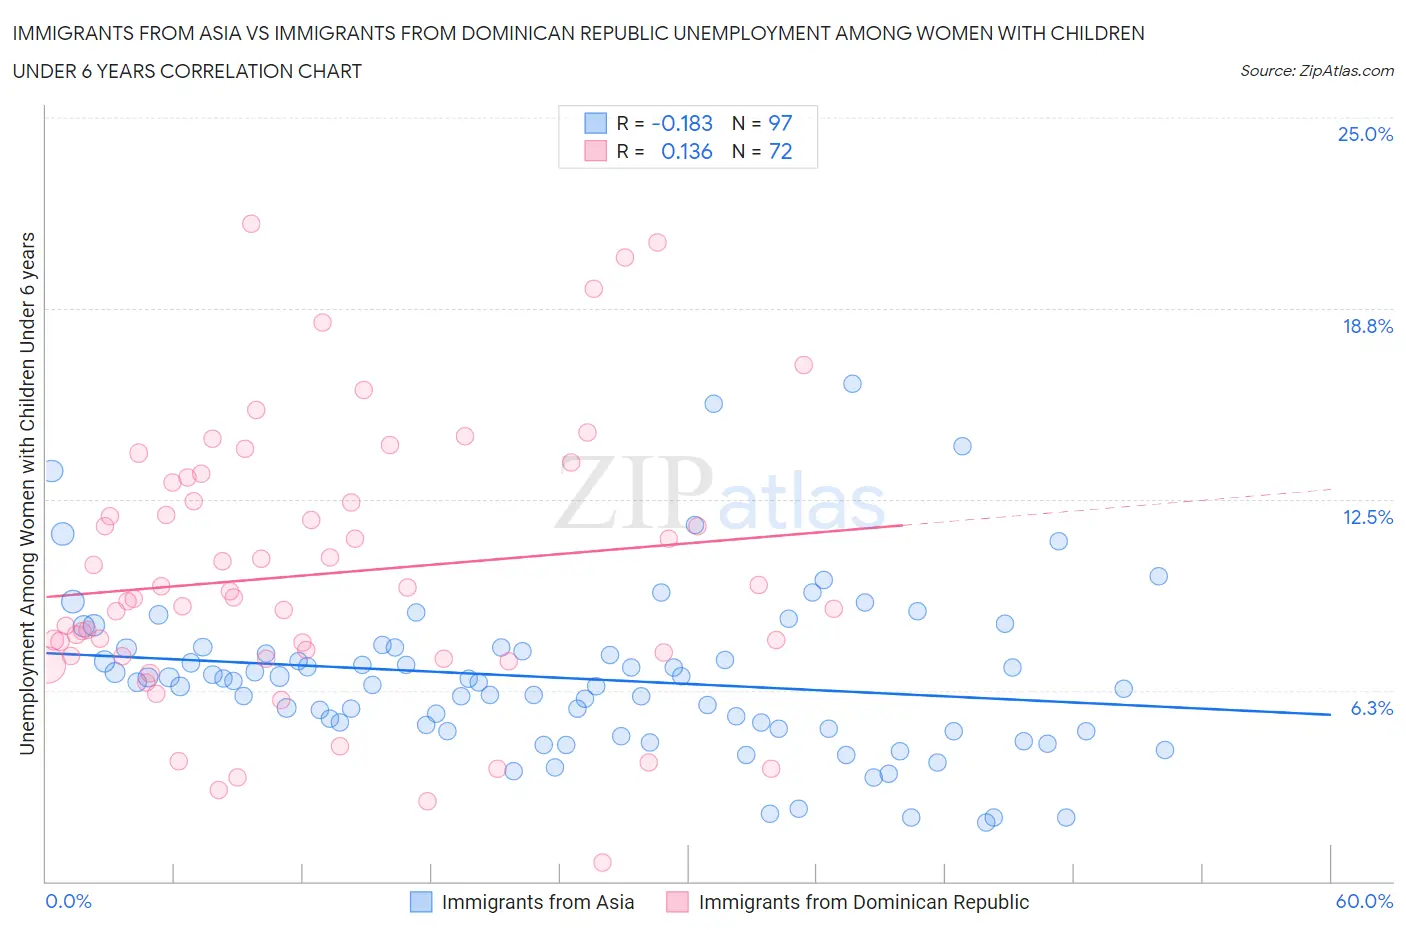
The statistical analysis conducted on geographies consisting of 374,283,619 people shows a poor negative correlation between the proportion of Immigrants from Asia and unemployment rate among women with children under the age of 6 in the United States with a correlation coefficient (R) of -0.183 and weighted average of 6.8%. Similarly, the statistical analysis conducted on geographies consisting of 221,187,094 people shows a poor positive correlation between the proportion of Immigrants from Dominican Republic and unemployment rate among women with children under the age of 6 in the United States with a correlation coefficient (R) of 0.136 and weighted average of 8.9%, a difference of 30.8%.
Unemployment Among Women with Children Under 6 years Correlation Summary
| Measurement | Immigrants from Asia | Immigrants from Dominican Republic |
| Minimum | 1.9% | 0.60% |
| Maximum | 16.3% | 21.5% |
| Range | 14.4% | 20.9% |
| Mean | 6.6% | 10.1% |
| Median | 6.5% | 9.3% |
| Interquartile 25% (IQ1) | 5.0% | 7.4% |
| Interquartile 75% (IQ3) | 7.6% | 12.8% |
| Interquartile Range (IQR) | 2.7% | 5.4% |
| Standard Deviation (Sample) | 2.7% | 4.4% |
| Standard Deviation (Population) | 2.7% | 4.4% |
Similar Demographics by Unemployment Among Women with Children Under 6 years
Demographics Similar to Immigrants from Asia by Unemployment Among Women with Children Under 6 years
In terms of unemployment among women with children under 6 years, the demographic groups most similar to Immigrants from Asia are Immigrants from Switzerland (6.8%, a difference of 0.030%), Immigrants from Nepal (6.8%, a difference of 0.080%), Immigrants from Ireland (6.8%, a difference of 0.090%), Ethiopian (6.8%, a difference of 0.11%), and Latvian (6.8%, a difference of 0.17%).
| Demographics | Rating | Rank | Unemployment Among Women with Children Under 6 years |
| Asians | 100.0 /100 | #40 | Exceptional 6.7% |
| Immigrants | Indonesia | 99.9 /100 | #41 | Exceptional 6.7% |
| Immigrants | Cuba | 99.9 /100 | #42 | Exceptional 6.7% |
| Bhutanese | 99.9 /100 | #43 | Exceptional 6.7% |
| Iranians | 99.9 /100 | #44 | Exceptional 6.7% |
| Immigrants | Australia | 99.9 /100 | #45 | Exceptional 6.8% |
| Latvians | 99.9 /100 | #46 | Exceptional 6.8% |
| Immigrants | Asia | 99.9 /100 | #47 | Exceptional 6.8% |
| Immigrants | Switzerland | 99.9 /100 | #48 | Exceptional 6.8% |
| Immigrants | Nepal | 99.9 /100 | #49 | Exceptional 6.8% |
| Immigrants | Ireland | 99.9 /100 | #50 | Exceptional 6.8% |
| Ethiopians | 99.9 /100 | #51 | Exceptional 6.8% |
| Immigrants | Iran | 99.9 /100 | #52 | Exceptional 6.8% |
| Chinese | 99.9 /100 | #53 | Exceptional 6.8% |
| Immigrants | Latvia | 99.9 /100 | #54 | Exceptional 6.8% |
Demographics Similar to Immigrants from Dominican Republic by Unemployment Among Women with Children Under 6 years
In terms of unemployment among women with children under 6 years, the demographic groups most similar to Immigrants from Dominican Republic are Mexican (8.9%, a difference of 0.10%), Immigrants from Central America (8.9%, a difference of 0.13%), Nonimmigrants (8.8%, a difference of 0.18%), Tlingit-Haida (8.9%, a difference of 0.25%), and Immigrants from Bangladesh (8.8%, a difference of 0.36%).
| Demographics | Rating | Rank | Unemployment Among Women with Children Under 6 years |
| Iroquois | 0.0 /100 | #289 | Tragic 8.7% |
| Vietnamese | 0.0 /100 | #290 | Tragic 8.8% |
| Jamaicans | 0.0 /100 | #291 | Tragic 8.8% |
| Cheyenne | 0.0 /100 | #292 | Tragic 8.8% |
| Immigrants | Bangladesh | 0.0 /100 | #293 | Tragic 8.8% |
| Immigrants | Nonimmigrants | 0.0 /100 | #294 | Tragic 8.8% |
| Immigrants | Central America | 0.0 /100 | #295 | Tragic 8.9% |
| Immigrants | Dominican Republic | 0.0 /100 | #296 | Tragic 8.9% |
| Mexicans | 0.0 /100 | #297 | Tragic 8.9% |
| Tlingit-Haida | 0.0 /100 | #298 | Tragic 8.9% |
| Immigrants | Jamaica | 0.0 /100 | #299 | Tragic 8.9% |
| Creek | 0.0 /100 | #300 | Tragic 8.9% |
| Chickasaw | 0.0 /100 | #301 | Tragic 9.0% |
| Hispanics or Latinos | 0.0 /100 | #302 | Tragic 9.0% |
| Immigrants | West Indies | 0.0 /100 | #303 | Tragic 9.0% |