German vs Immigrants from Burma/Myanmar Unemployment Among Women with Children Under 6 years
COMPARE
German
Immigrants from Burma/Myanmar
Unemployment Among Women with Children Under 6 years
Unemployment Among Women with Children Under 6 years Comparison
Germans
Immigrants from Burma/Myanmar
8.0%
UNEMPLOYMENT AMONG WOMEN WITH CHILDREN UNDER 6 YEARS
7.0/ 100
METRIC RATING
225th/ 347
METRIC RANK
7.3%
UNEMPLOYMENT AMONG WOMEN WITH CHILDREN UNDER 6 YEARS
91.9/ 100
METRIC RATING
126th/ 347
METRIC RANK
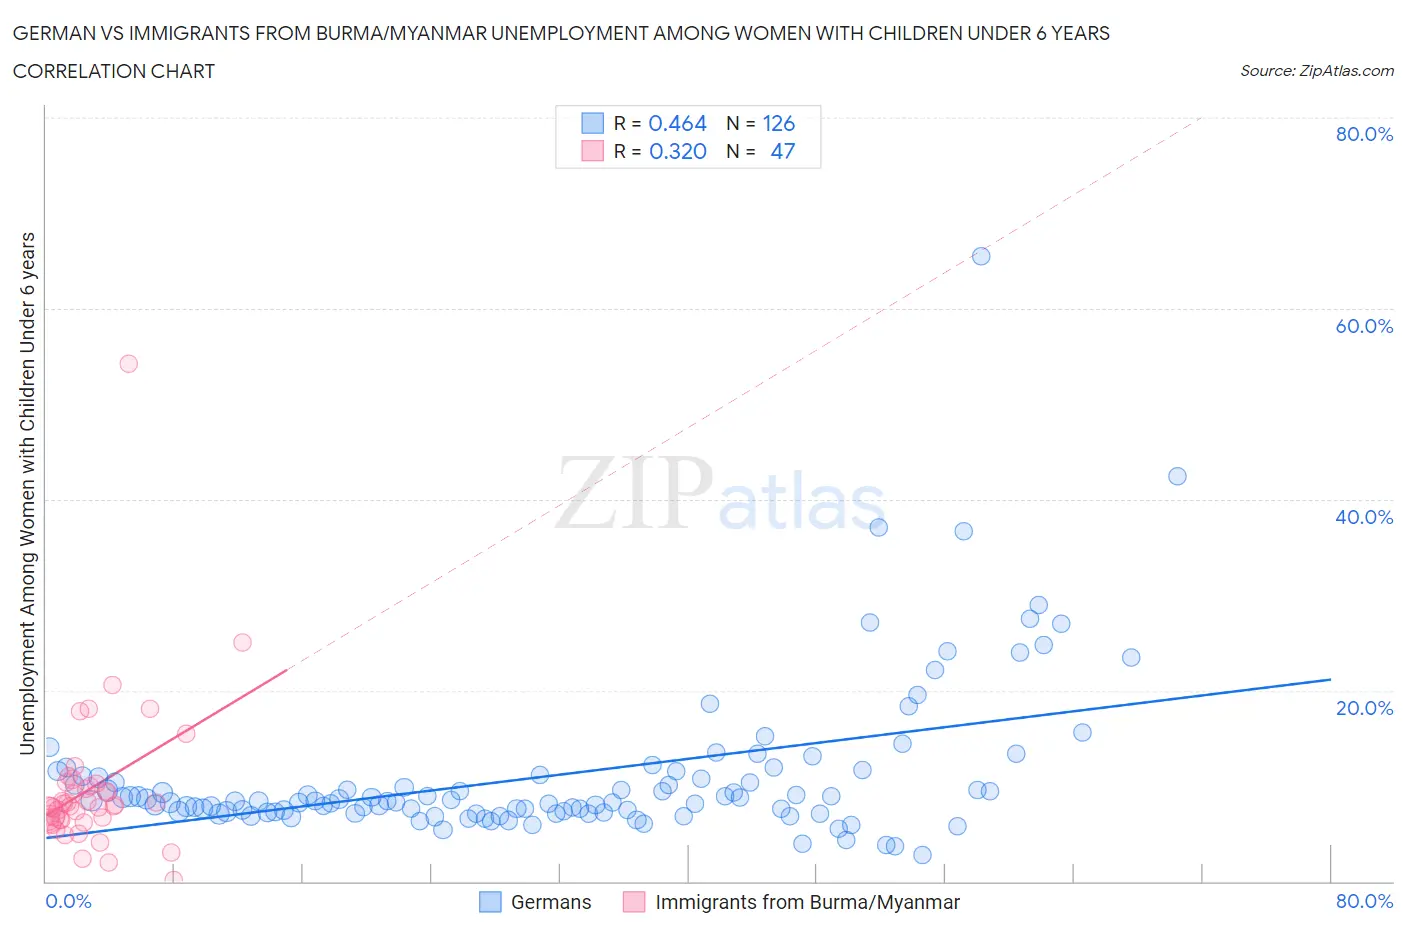
German vs Immigrants from Burma/Myanmar Unemployment Among Women with Children Under 6 years Correlation Chart
The statistical analysis conducted on geographies consisting of 379,455,482 people shows a moderate positive correlation between the proportion of Germans and unemployment rate among women with children under the age of 6 in the United States with a correlation coefficient (R) of 0.464 and weighted average of 8.0%. Similarly, the statistical analysis conducted on geographies consisting of 151,981,600 people shows a mild positive correlation between the proportion of Immigrants from Burma/Myanmar and unemployment rate among women with children under the age of 6 in the United States with a correlation coefficient (R) of 0.320 and weighted average of 7.3%, a difference of 8.6%.
Unemployment Among Women with Children Under 6 years Correlation Summary
| Measurement | German | Immigrants from Burma/Myanmar |
| Minimum | 2.7% | 0.10% |
| Maximum | 65.5% | 54.2% |
| Range | 62.8% | 54.1% |
| Mean | 11.1% | 9.8% |
| Median | 8.4% | 7.9% |
| Interquartile 25% (IQ1) | 7.3% | 6.5% |
| Interquartile 75% (IQ3) | 11.0% | 10.2% |
| Interquartile Range (IQR) | 3.7% | 3.7% |
| Standard Deviation (Sample) | 8.3% | 8.2% |
| Standard Deviation (Population) | 8.3% | 8.1% |
Similar Demographics by Unemployment Among Women with Children Under 6 years
Demographics Similar to Germans by Unemployment Among Women with Children Under 6 years
In terms of unemployment among women with children under 6 years, the demographic groups most similar to Germans are English (8.0%, a difference of 0.030%), Carpatho Rusyn (8.0%, a difference of 0.17%), Senegalese (8.0%, a difference of 0.22%), Portuguese (8.0%, a difference of 0.22%), and Immigrants from Sudan (8.0%, a difference of 0.26%).
| Demographics | Rating | Rank | Unemployment Among Women with Children Under 6 years |
| Moroccans | 9.7 /100 | #218 | Tragic 7.9% |
| Arabs | 9.4 /100 | #219 | Tragic 7.9% |
| South American Indians | 9.3 /100 | #220 | Tragic 7.9% |
| Immigrants | Germany | 8.5 /100 | #221 | Tragic 7.9% |
| Samoans | 8.4 /100 | #222 | Tragic 7.9% |
| Carpatho Rusyns | 7.8 /100 | #223 | Tragic 8.0% |
| English | 7.2 /100 | #224 | Tragic 8.0% |
| Germans | 7.0 /100 | #225 | Tragic 8.0% |
| Senegalese | 6.2 /100 | #226 | Tragic 8.0% |
| Portuguese | 6.2 /100 | #227 | Tragic 8.0% |
| Immigrants | Sudan | 6.0 /100 | #228 | Tragic 8.0% |
| Salvadorans | 5.5 /100 | #229 | Tragic 8.0% |
| Finns | 5.3 /100 | #230 | Tragic 8.0% |
| Trinidadians and Tobagonians | 5.3 /100 | #231 | Tragic 8.0% |
| Welsh | 5.0 /100 | #232 | Tragic 8.0% |
Demographics Similar to Immigrants from Burma/Myanmar by Unemployment Among Women with Children Under 6 years
In terms of unemployment among women with children under 6 years, the demographic groups most similar to Immigrants from Burma/Myanmar are Pakistani (7.3%, a difference of 0.070%), Jordanian (7.3%, a difference of 0.10%), Zimbabwean (7.3%, a difference of 0.10%), Immigrants from South Africa (7.3%, a difference of 0.15%), and Immigrants from Zaire (7.3%, a difference of 0.34%).
| Demographics | Rating | Rank | Unemployment Among Women with Children Under 6 years |
| South Africans | 94.1 /100 | #119 | Exceptional 7.3% |
| Iraqis | 93.9 /100 | #120 | Exceptional 7.3% |
| Immigrants | Chile | 93.5 /100 | #121 | Exceptional 7.3% |
| Immigrants | Bosnia and Herzegovina | 93.5 /100 | #122 | Exceptional 7.3% |
| Immigrants | Zaire | 93.3 /100 | #123 | Exceptional 7.3% |
| Immigrants | South Africa | 92.5 /100 | #124 | Exceptional 7.3% |
| Pakistanis | 92.2 /100 | #125 | Exceptional 7.3% |
| Immigrants | Burma/Myanmar | 91.9 /100 | #126 | Exceptional 7.3% |
| Jordanians | 91.5 /100 | #127 | Exceptional 7.3% |
| Zimbabweans | 91.5 /100 | #128 | Exceptional 7.3% |
| Slovenes | 89.2 /100 | #129 | Excellent 7.4% |
| Swedes | 88.4 /100 | #130 | Excellent 7.4% |
| Ukrainians | 88.2 /100 | #131 | Excellent 7.4% |
| Immigrants | Armenia | 87.4 /100 | #132 | Excellent 7.4% |
| Immigrants | Uganda | 86.5 /100 | #133 | Excellent 7.4% |