Tohono O'odham vs Immigrants from Burma/Myanmar Unemployment Among Women with Children Under 6 years
COMPARE
Tohono O'odham
Immigrants from Burma/Myanmar
Unemployment Among Women with Children Under 6 years
Unemployment Among Women with Children Under 6 years Comparison
Tohono O'odham
Immigrants from Burma/Myanmar
10.2%
UNEMPLOYMENT AMONG WOMEN WITH CHILDREN UNDER 6 YEARS
0.0/ 100
METRIC RATING
328th/ 347
METRIC RANK
7.3%
UNEMPLOYMENT AMONG WOMEN WITH CHILDREN UNDER 6 YEARS
91.9/ 100
METRIC RATING
126th/ 347
METRIC RANK
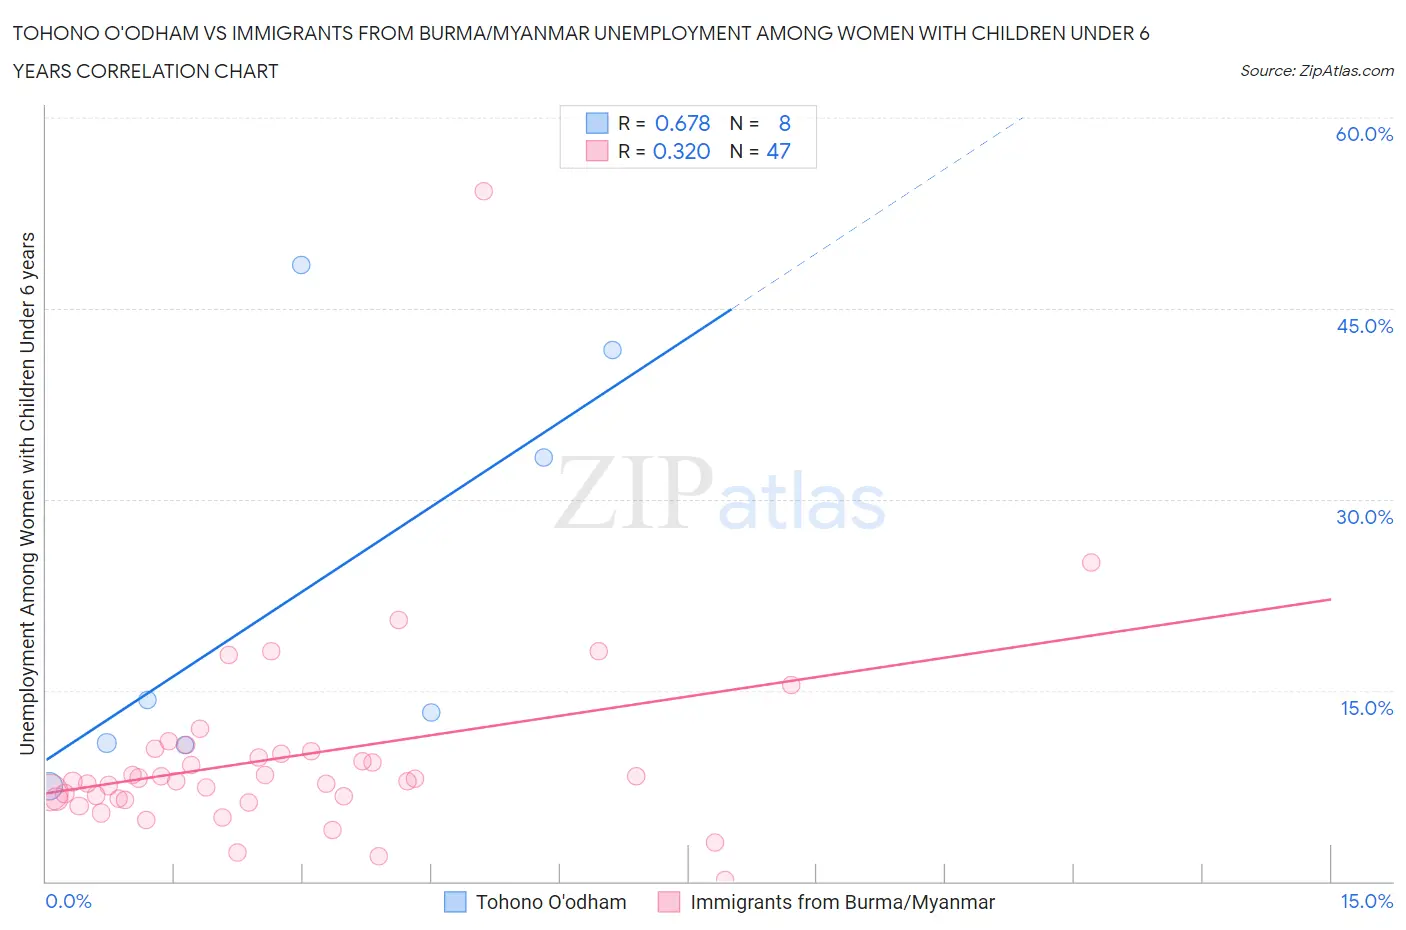
Tohono O'odham vs Immigrants from Burma/Myanmar Unemployment Among Women with Children Under 6 years Correlation Chart
The statistical analysis conducted on geographies consisting of 55,207,306 people shows a significant positive correlation between the proportion of Tohono O'odham and unemployment rate among women with children under the age of 6 in the United States with a correlation coefficient (R) of 0.678 and weighted average of 10.2%. Similarly, the statistical analysis conducted on geographies consisting of 151,981,600 people shows a mild positive correlation between the proportion of Immigrants from Burma/Myanmar and unemployment rate among women with children under the age of 6 in the United States with a correlation coefficient (R) of 0.320 and weighted average of 7.3%, a difference of 39.0%.
Unemployment Among Women with Children Under 6 years Correlation Summary
| Measurement | Tohono O'odham | Immigrants from Burma/Myanmar |
| Minimum | 7.5% | 0.10% |
| Maximum | 48.4% | 54.2% |
| Range | 40.9% | 54.1% |
| Mean | 22.5% | 9.8% |
| Median | 13.8% | 7.9% |
| Interquartile 25% (IQ1) | 10.8% | 6.5% |
| Interquartile 75% (IQ3) | 37.5% | 10.2% |
| Interquartile Range (IQR) | 26.7% | 3.7% |
| Standard Deviation (Sample) | 16.1% | 8.2% |
| Standard Deviation (Population) | 15.0% | 8.1% |
Similar Demographics by Unemployment Among Women with Children Under 6 years
Demographics Similar to Tohono O'odham by Unemployment Among Women with Children Under 6 years
In terms of unemployment among women with children under 6 years, the demographic groups most similar to Tohono O'odham are Black/African American (10.3%, a difference of 0.74%), Ottawa (9.9%, a difference of 3.3%), Delaware (9.8%, a difference of 4.2%), Choctaw (9.8%, a difference of 4.2%), and Paiute (9.7%, a difference of 5.2%).
| Demographics | Rating | Rank | Unemployment Among Women with Children Under 6 years |
| Central American Indians | 0.0 /100 | #321 | Tragic 9.6% |
| Alaska Natives | 0.0 /100 | #322 | Tragic 9.6% |
| Immigrants | Bahamas | 0.0 /100 | #323 | Tragic 9.6% |
| Paiute | 0.0 /100 | #324 | Tragic 9.7% |
| Choctaw | 0.0 /100 | #325 | Tragic 9.8% |
| Delaware | 0.0 /100 | #326 | Tragic 9.8% |
| Ottawa | 0.0 /100 | #327 | Tragic 9.9% |
| Tohono O'odham | 0.0 /100 | #328 | Tragic 10.2% |
| Blacks/African Americans | 0.0 /100 | #329 | Tragic 10.3% |
| Pennsylvania Germans | 0.0 /100 | #330 | Tragic 10.8% |
| Colville | 0.0 /100 | #331 | Tragic 11.2% |
| Sioux | 0.0 /100 | #332 | Tragic 11.5% |
| Natives/Alaskans | 0.0 /100 | #333 | Tragic 11.5% |
| Apache | 0.0 /100 | #334 | Tragic 12.3% |
| Puerto Ricans | 0.0 /100 | #335 | Tragic 12.5% |
Demographics Similar to Immigrants from Burma/Myanmar by Unemployment Among Women with Children Under 6 years
In terms of unemployment among women with children under 6 years, the demographic groups most similar to Immigrants from Burma/Myanmar are Pakistani (7.3%, a difference of 0.070%), Jordanian (7.3%, a difference of 0.10%), Zimbabwean (7.3%, a difference of 0.10%), Immigrants from South Africa (7.3%, a difference of 0.15%), and Immigrants from Zaire (7.3%, a difference of 0.34%).
| Demographics | Rating | Rank | Unemployment Among Women with Children Under 6 years |
| South Africans | 94.1 /100 | #119 | Exceptional 7.3% |
| Iraqis | 93.9 /100 | #120 | Exceptional 7.3% |
| Immigrants | Chile | 93.5 /100 | #121 | Exceptional 7.3% |
| Immigrants | Bosnia and Herzegovina | 93.5 /100 | #122 | Exceptional 7.3% |
| Immigrants | Zaire | 93.3 /100 | #123 | Exceptional 7.3% |
| Immigrants | South Africa | 92.5 /100 | #124 | Exceptional 7.3% |
| Pakistanis | 92.2 /100 | #125 | Exceptional 7.3% |
| Immigrants | Burma/Myanmar | 91.9 /100 | #126 | Exceptional 7.3% |
| Jordanians | 91.5 /100 | #127 | Exceptional 7.3% |
| Zimbabweans | 91.5 /100 | #128 | Exceptional 7.3% |
| Slovenes | 89.2 /100 | #129 | Excellent 7.4% |
| Swedes | 88.4 /100 | #130 | Excellent 7.4% |
| Ukrainians | 88.2 /100 | #131 | Excellent 7.4% |
| Immigrants | Armenia | 87.4 /100 | #132 | Excellent 7.4% |
| Immigrants | Uganda | 86.5 /100 | #133 | Excellent 7.4% |