Asian vs Immigrants from Afghanistan Unemployment Among Women with Children Under 6 years
COMPARE
Asian
Immigrants from Afghanistan
Unemployment Among Women with Children Under 6 years
Unemployment Among Women with Children Under 6 years Comparison
Asians
Immigrants from Afghanistan
6.7%
UNEMPLOYMENT AMONG WOMEN WITH CHILDREN UNDER 6 YEARS
100.0/ 100
METRIC RATING
40th/ 347
METRIC RANK
7.1%
UNEMPLOYMENT AMONG WOMEN WITH CHILDREN UNDER 6 YEARS
98.7/ 100
METRIC RATING
82nd/ 347
METRIC RANK
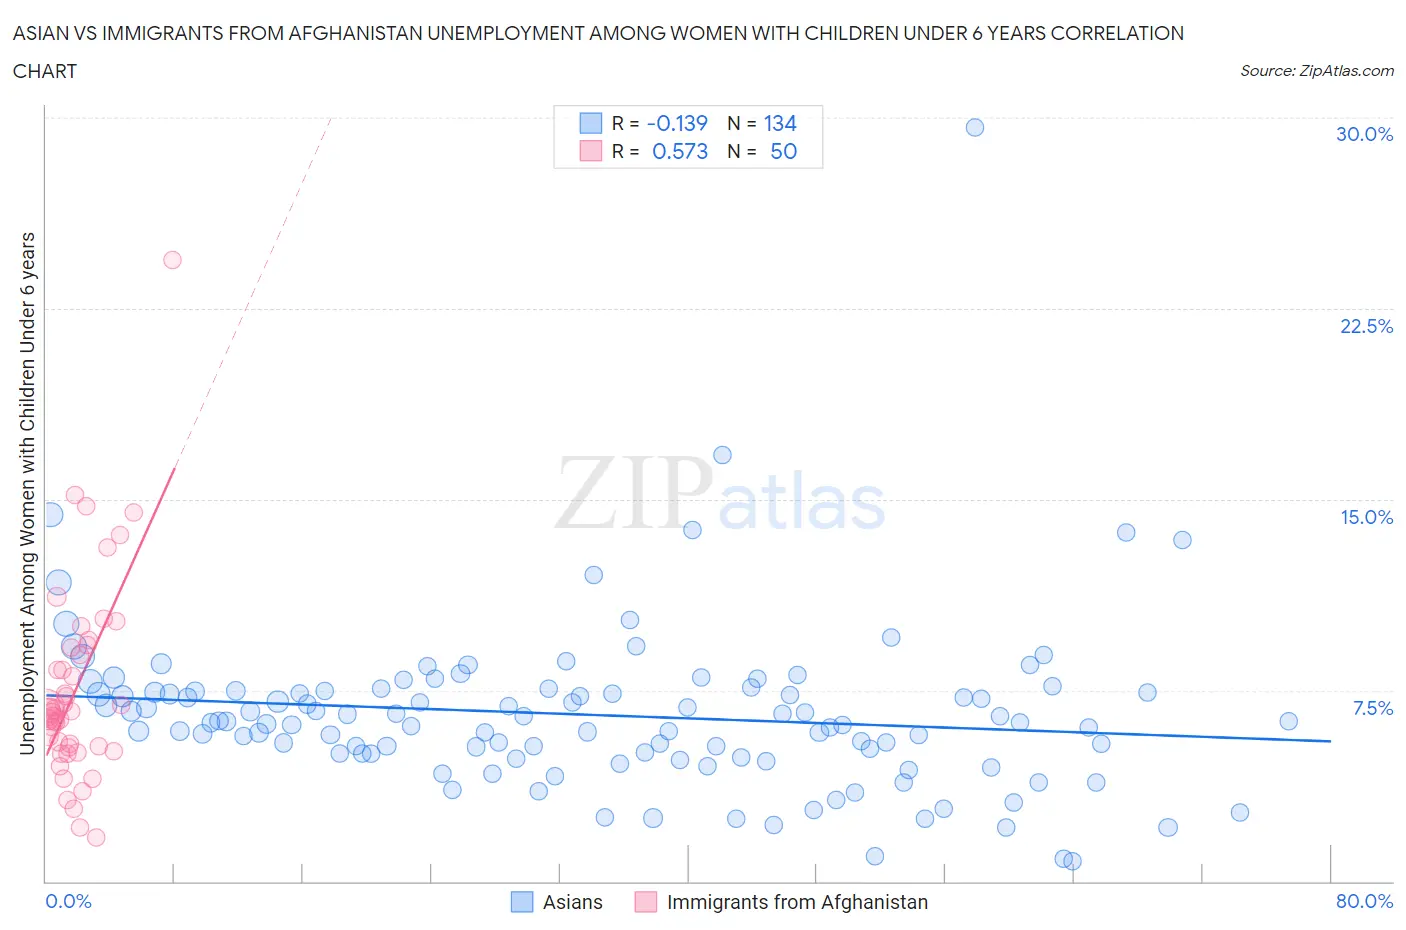
Asian vs Immigrants from Afghanistan Unemployment Among Women with Children Under 6 years Correlation Chart
The statistical analysis conducted on geographies consisting of 374,627,418 people shows a poor negative correlation between the proportion of Asians and unemployment rate among women with children under the age of 6 in the United States with a correlation coefficient (R) of -0.139 and weighted average of 6.7%. Similarly, the statistical analysis conducted on geographies consisting of 132,201,739 people shows a substantial positive correlation between the proportion of Immigrants from Afghanistan and unemployment rate among women with children under the age of 6 in the United States with a correlation coefficient (R) of 0.573 and weighted average of 7.1%, a difference of 6.3%.
Unemployment Among Women with Children Under 6 years Correlation Summary
| Measurement | Asian | Immigrants from Afghanistan |
| Minimum | 0.80% | 1.7% |
| Maximum | 29.6% | 24.4% |
| Range | 28.8% | 22.7% |
| Mean | 6.5% | 7.6% |
| Median | 6.3% | 6.7% |
| Interquartile 25% (IQ1) | 5.0% | 5.3% |
| Interquartile 75% (IQ3) | 7.5% | 9.2% |
| Interquartile Range (IQR) | 2.5% | 3.9% |
| Standard Deviation (Sample) | 3.3% | 4.0% |
| Standard Deviation (Population) | 3.3% | 3.9% |
Similar Demographics by Unemployment Among Women with Children Under 6 years
Demographics Similar to Asians by Unemployment Among Women with Children Under 6 years
In terms of unemployment among women with children under 6 years, the demographic groups most similar to Asians are Immigrants from Indonesia (6.7%, a difference of 0.16%), Immigrants from Russia (6.7%, a difference of 0.22%), Immigrants from Cuba (6.7%, a difference of 0.26%), Hmong (6.7%, a difference of 0.28%), and Sri Lankan (6.6%, a difference of 0.41%).
| Demographics | Rating | Rank | Unemployment Among Women with Children Under 6 years |
| Immigrants | Vietnam | 100.0 /100 | #33 | Exceptional 6.6% |
| Immigrants | South Central Asia | 100.0 /100 | #34 | Exceptional 6.6% |
| Yakama | 100.0 /100 | #35 | Exceptional 6.6% |
| Luxembourgers | 100.0 /100 | #36 | Exceptional 6.6% |
| Sri Lankans | 100.0 /100 | #37 | Exceptional 6.6% |
| Hmong | 100.0 /100 | #38 | Exceptional 6.7% |
| Immigrants | Russia | 100.0 /100 | #39 | Exceptional 6.7% |
| Asians | 100.0 /100 | #40 | Exceptional 6.7% |
| Immigrants | Indonesia | 99.9 /100 | #41 | Exceptional 6.7% |
| Immigrants | Cuba | 99.9 /100 | #42 | Exceptional 6.7% |
| Bhutanese | 99.9 /100 | #43 | Exceptional 6.7% |
| Iranians | 99.9 /100 | #44 | Exceptional 6.7% |
| Immigrants | Australia | 99.9 /100 | #45 | Exceptional 6.8% |
| Latvians | 99.9 /100 | #46 | Exceptional 6.8% |
| Immigrants | Asia | 99.9 /100 | #47 | Exceptional 6.8% |
Demographics Similar to Immigrants from Afghanistan by Unemployment Among Women with Children Under 6 years
In terms of unemployment among women with children under 6 years, the demographic groups most similar to Immigrants from Afghanistan are Egyptian (7.1%, a difference of 0.030%), Immigrants from Albania (7.1%, a difference of 0.080%), Immigrants from Romania (7.1%, a difference of 0.12%), Immigrants from Venezuela (7.1%, a difference of 0.15%), and Immigrants from Greece (7.1%, a difference of 0.19%).
| Demographics | Rating | Rank | Unemployment Among Women with Children Under 6 years |
| Immigrants | Eastern Europe | 99.0 /100 | #75 | Exceptional 7.1% |
| Estonians | 99.0 /100 | #76 | Exceptional 7.1% |
| Immigrants | Croatia | 98.9 /100 | #77 | Exceptional 7.1% |
| Immigrants | Somalia | 98.9 /100 | #78 | Exceptional 7.1% |
| Immigrants | Fiji | 98.9 /100 | #79 | Exceptional 7.1% |
| Immigrants | Greece | 98.9 /100 | #80 | Exceptional 7.1% |
| Immigrants | Venezuela | 98.8 /100 | #81 | Exceptional 7.1% |
| Immigrants | Afghanistan | 98.7 /100 | #82 | Exceptional 7.1% |
| Egyptians | 98.7 /100 | #83 | Exceptional 7.1% |
| Immigrants | Albania | 98.7 /100 | #84 | Exceptional 7.1% |
| Immigrants | Romania | 98.7 /100 | #85 | Exceptional 7.1% |
| Immigrants | Zimbabwe | 98.6 /100 | #86 | Exceptional 7.1% |
| Alsatians | 98.4 /100 | #87 | Exceptional 7.1% |
| Immigrants | Hungary | 98.3 /100 | #88 | Exceptional 7.1% |
| Immigrants | Denmark | 98.3 /100 | #89 | Exceptional 7.1% |