Slavic vs Immigrants from Afghanistan Unemployment Among Women with Children Under 6 years
COMPARE
Slavic
Immigrants from Afghanistan
Unemployment Among Women with Children Under 6 years
Unemployment Among Women with Children Under 6 years Comparison
Slavs
Immigrants from Afghanistan
7.7%
UNEMPLOYMENT AMONG WOMEN WITH CHILDREN UNDER 6 YEARS
32.4/ 100
METRIC RATING
193rd/ 347
METRIC RANK
7.1%
UNEMPLOYMENT AMONG WOMEN WITH CHILDREN UNDER 6 YEARS
98.7/ 100
METRIC RATING
82nd/ 347
METRIC RANK
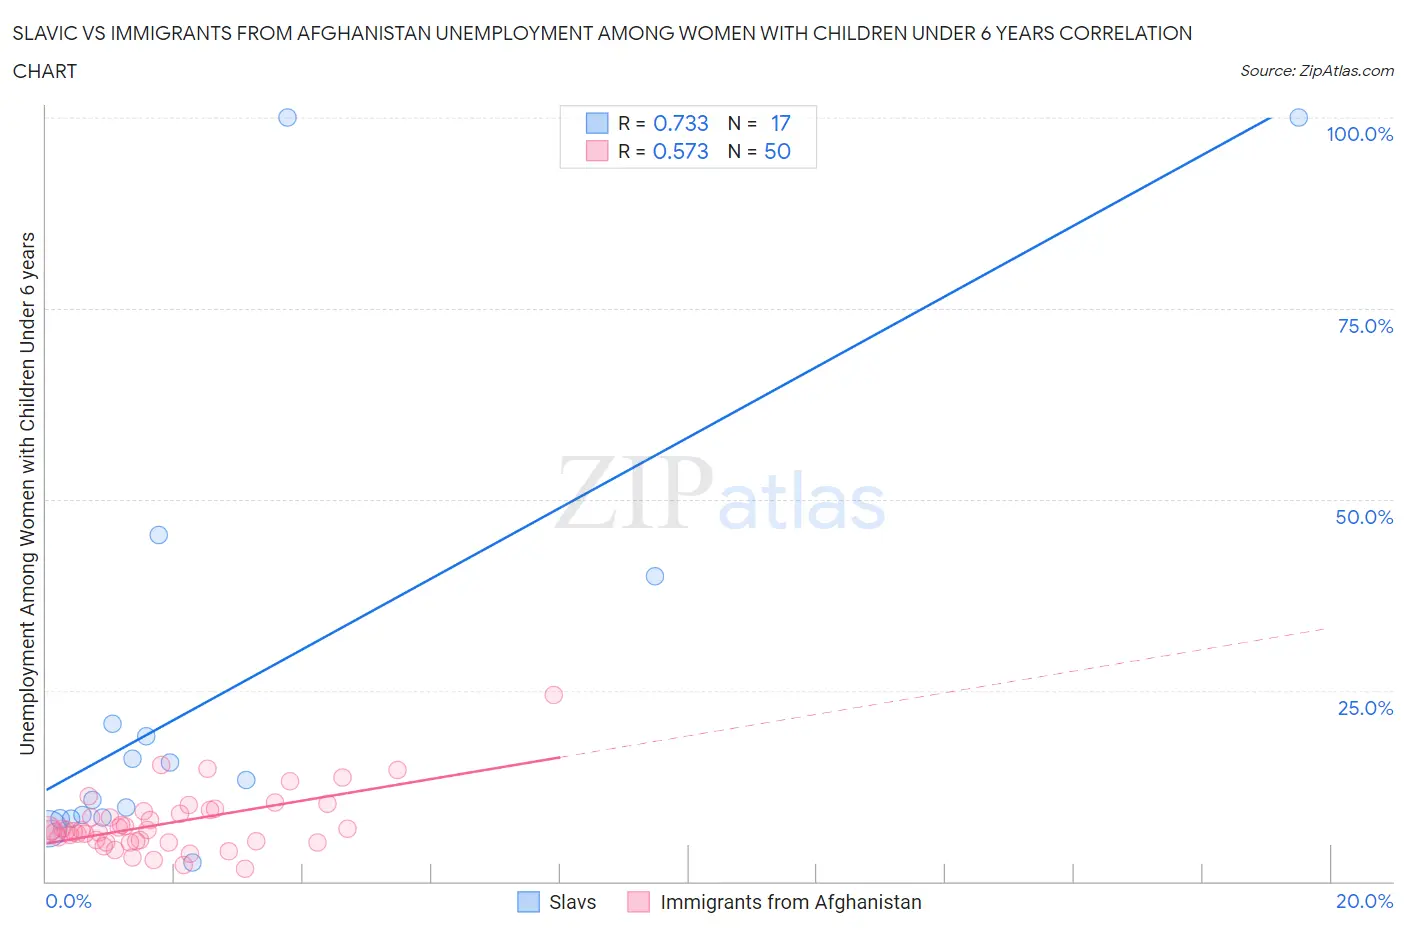
Slavic vs Immigrants from Afghanistan Unemployment Among Women with Children Under 6 years Correlation Chart
The statistical analysis conducted on geographies consisting of 210,803,228 people shows a strong positive correlation between the proportion of Slavs and unemployment rate among women with children under the age of 6 in the United States with a correlation coefficient (R) of 0.733 and weighted average of 7.7%. Similarly, the statistical analysis conducted on geographies consisting of 132,201,739 people shows a substantial positive correlation between the proportion of Immigrants from Afghanistan and unemployment rate among women with children under the age of 6 in the United States with a correlation coefficient (R) of 0.573 and weighted average of 7.1%, a difference of 9.1%.
Unemployment Among Women with Children Under 6 years Correlation Summary
| Measurement | Slavic | Immigrants from Afghanistan |
| Minimum | 2.5% | 1.7% |
| Maximum | 100.0% | 24.4% |
| Range | 97.5% | 22.7% |
| Mean | 25.5% | 7.6% |
| Median | 13.3% | 6.7% |
| Interquartile 25% (IQ1) | 8.3% | 5.3% |
| Interquartile 75% (IQ3) | 30.3% | 9.2% |
| Interquartile Range (IQR) | 22.1% | 3.9% |
| Standard Deviation (Sample) | 30.2% | 4.0% |
| Standard Deviation (Population) | 29.3% | 3.9% |
Similar Demographics by Unemployment Among Women with Children Under 6 years
Demographics Similar to Slavs by Unemployment Among Women with Children Under 6 years
In terms of unemployment among women with children under 6 years, the demographic groups most similar to Slavs are Immigrants from Africa (7.7%, a difference of 0.0%), Immigrants from Austria (7.7%, a difference of 0.010%), Syrian (7.7%, a difference of 0.040%), Malaysian (7.7%, a difference of 0.10%), and Immigrants from St. Vincent and the Grenadines (7.7%, a difference of 0.10%).
| Demographics | Rating | Rank | Unemployment Among Women with Children Under 6 years |
| Yugoslavians | 39.4 /100 | #186 | Fair 7.7% |
| Immigrants | Thailand | 38.5 /100 | #187 | Fair 7.7% |
| Czechoslovakians | 38.4 /100 | #188 | Fair 7.7% |
| Immigrants | Panama | 35.7 /100 | #189 | Fair 7.7% |
| Immigrants | North Macedonia | 34.4 /100 | #190 | Fair 7.7% |
| Immigrants | Austria | 32.4 /100 | #191 | Fair 7.7% |
| Immigrants | Africa | 32.4 /100 | #192 | Fair 7.7% |
| Slavs | 32.4 /100 | #193 | Fair 7.7% |
| Syrians | 31.9 /100 | #194 | Fair 7.7% |
| Malaysians | 31.1 /100 | #195 | Fair 7.7% |
| Immigrants | St. Vincent and the Grenadines | 31.1 /100 | #196 | Fair 7.7% |
| Italians | 30.4 /100 | #197 | Fair 7.7% |
| Lithuanians | 30.0 /100 | #198 | Fair 7.8% |
| Immigrants | Poland | 27.3 /100 | #199 | Fair 7.8% |
| Guamanians/Chamorros | 25.5 /100 | #200 | Fair 7.8% |
Demographics Similar to Immigrants from Afghanistan by Unemployment Among Women with Children Under 6 years
In terms of unemployment among women with children under 6 years, the demographic groups most similar to Immigrants from Afghanistan are Egyptian (7.1%, a difference of 0.030%), Immigrants from Albania (7.1%, a difference of 0.080%), Immigrants from Romania (7.1%, a difference of 0.12%), Immigrants from Venezuela (7.1%, a difference of 0.15%), and Immigrants from Greece (7.1%, a difference of 0.19%).
| Demographics | Rating | Rank | Unemployment Among Women with Children Under 6 years |
| Immigrants | Eastern Europe | 99.0 /100 | #75 | Exceptional 7.1% |
| Estonians | 99.0 /100 | #76 | Exceptional 7.1% |
| Immigrants | Croatia | 98.9 /100 | #77 | Exceptional 7.1% |
| Immigrants | Somalia | 98.9 /100 | #78 | Exceptional 7.1% |
| Immigrants | Fiji | 98.9 /100 | #79 | Exceptional 7.1% |
| Immigrants | Greece | 98.9 /100 | #80 | Exceptional 7.1% |
| Immigrants | Venezuela | 98.8 /100 | #81 | Exceptional 7.1% |
| Immigrants | Afghanistan | 98.7 /100 | #82 | Exceptional 7.1% |
| Egyptians | 98.7 /100 | #83 | Exceptional 7.1% |
| Immigrants | Albania | 98.7 /100 | #84 | Exceptional 7.1% |
| Immigrants | Romania | 98.7 /100 | #85 | Exceptional 7.1% |
| Immigrants | Zimbabwe | 98.6 /100 | #86 | Exceptional 7.1% |
| Alsatians | 98.4 /100 | #87 | Exceptional 7.1% |
| Immigrants | Hungary | 98.3 /100 | #88 | Exceptional 7.1% |
| Immigrants | Denmark | 98.3 /100 | #89 | Exceptional 7.1% |