German Russian vs Spanish American Indian Unemployment
COMPARE
German Russian
Spanish American Indian
Unemployment
Unemployment Comparison
German Russians
Spanish American Indians
4.9%
UNEMPLOYMENT
98.0/ 100
METRIC RATING
76th/ 347
METRIC RANK
6.2%
UNEMPLOYMENT
0.0/ 100
METRIC RATING
294th/ 347
METRIC RANK
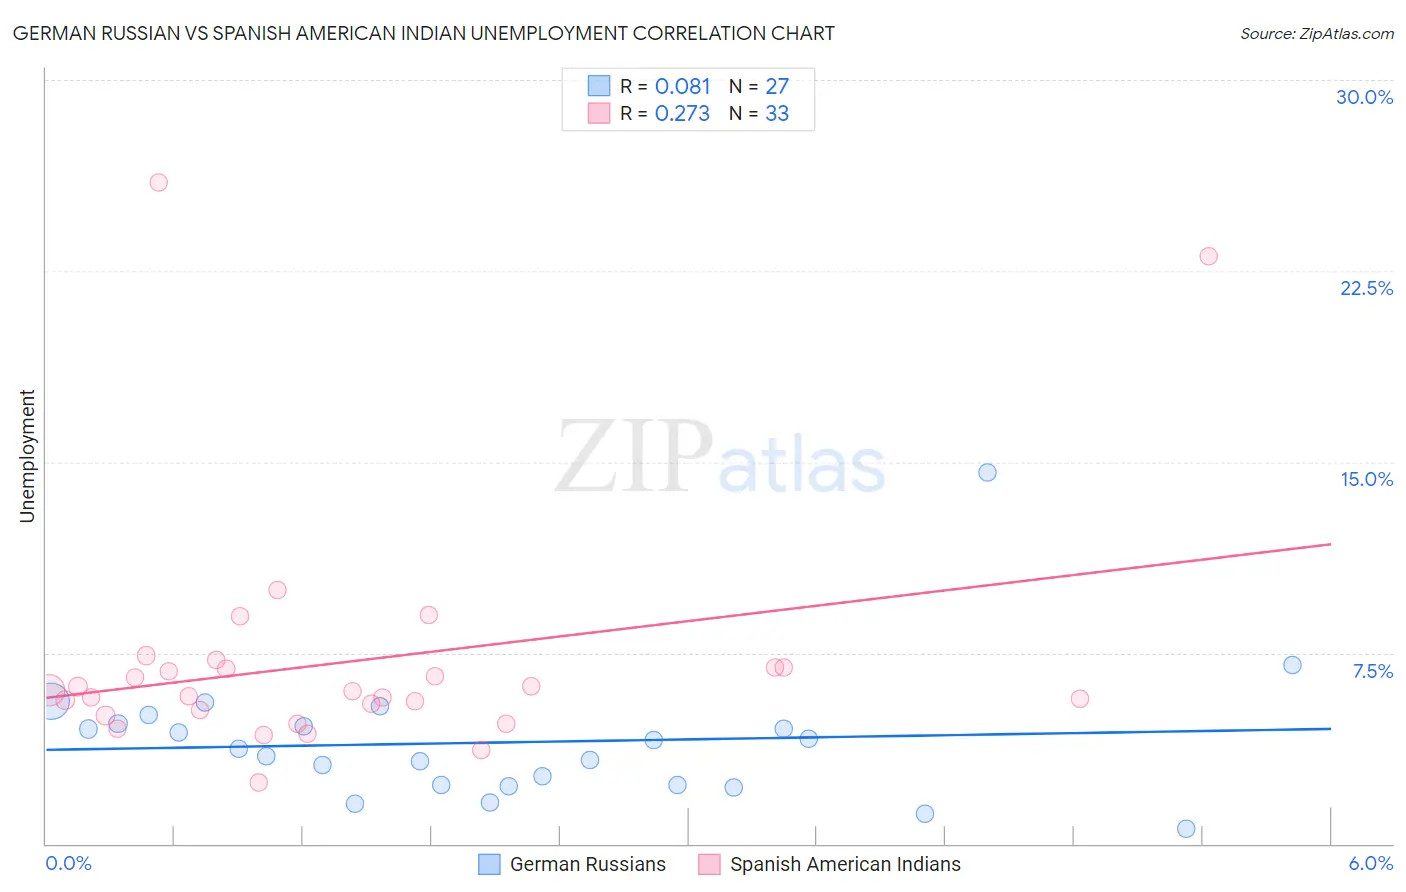
German Russian vs Spanish American Indian Unemployment Correlation Chart
The statistical analysis conducted on geographies consisting of 96,379,174 people shows a slight positive correlation between the proportion of German Russians and unemployment in the United States with a correlation coefficient (R) of 0.081 and weighted average of 4.9%. Similarly, the statistical analysis conducted on geographies consisting of 73,128,798 people shows a weak positive correlation between the proportion of Spanish American Indians and unemployment in the United States with a correlation coefficient (R) of 0.273 and weighted average of 6.2%, a difference of 26.3%.
Unemployment Correlation Summary
| Measurement | German Russian | Spanish American Indian |
| Minimum | 0.60% | 2.4% |
| Maximum | 14.6% | 26.0% |
| Range | 14.0% | 23.5% |
| Mean | 4.0% | 7.1% |
| Median | 3.8% | 6.0% |
| Interquartile 25% (IQ1) | 2.3% | 5.1% |
| Interquartile 75% (IQ3) | 4.7% | 6.9% |
| Interquartile Range (IQR) | 2.4% | 1.8% |
| Standard Deviation (Sample) | 2.6% | 4.7% |
| Standard Deviation (Population) | 2.6% | 4.7% |
Similar Demographics by Unemployment
Demographics Similar to German Russians by Unemployment
In terms of unemployment, the demographic groups most similar to German Russians are Turkish (4.9%, a difference of 0.030%), Cypriot (4.9%, a difference of 0.060%), Okinawan (4.9%, a difference of 0.10%), Immigrants from Northern Europe (4.9%, a difference of 0.16%), and Canadian (5.0%, a difference of 0.22%).
| Demographics | Rating | Rank | Unemployment |
| Immigrants | North America | 98.5 /100 | #69 | Exceptional 4.9% |
| Serbians | 98.4 /100 | #70 | Exceptional 4.9% |
| Immigrants | Japan | 98.3 /100 | #71 | Exceptional 4.9% |
| Burmese | 98.3 /100 | #72 | Exceptional 4.9% |
| Paraguayans | 98.3 /100 | #73 | Exceptional 4.9% |
| Immigrants | Northern Europe | 98.2 /100 | #74 | Exceptional 4.9% |
| Turks | 98.0 /100 | #75 | Exceptional 4.9% |
| German Russians | 98.0 /100 | #76 | Exceptional 4.9% |
| Cypriots | 97.9 /100 | #77 | Exceptional 4.9% |
| Okinawans | 97.9 /100 | #78 | Exceptional 4.9% |
| Canadians | 97.7 /100 | #79 | Exceptional 5.0% |
| Immigrants | Sweden | 97.6 /100 | #80 | Exceptional 5.0% |
| Basques | 97.6 /100 | #81 | Exceptional 5.0% |
| Fijians | 97.6 /100 | #82 | Exceptional 5.0% |
| Hmong | 97.6 /100 | #83 | Exceptional 5.0% |
Demographics Similar to Spanish American Indians by Unemployment
In terms of unemployment, the demographic groups most similar to Spanish American Indians are Immigrants from Ecuador (6.2%, a difference of 0.0%), Central American Indian (6.2%, a difference of 0.090%), Haitian (6.2%, a difference of 0.11%), U.S. Virgin Islander (6.3%, a difference of 0.12%), and Ute (6.3%, a difference of 0.57%).
| Demographics | Rating | Rank | Unemployment |
| Nepalese | 0.0 /100 | #287 | Tragic 6.2% |
| Ecuadorians | 0.0 /100 | #288 | Tragic 6.2% |
| Chippewa | 0.0 /100 | #289 | Tragic 6.2% |
| Senegalese | 0.0 /100 | #290 | Tragic 6.2% |
| Haitians | 0.0 /100 | #291 | Tragic 6.2% |
| Central American Indians | 0.0 /100 | #292 | Tragic 6.2% |
| Immigrants | Ecuador | 0.0 /100 | #293 | Tragic 6.2% |
| Spanish American Indians | 0.0 /100 | #294 | Tragic 6.2% |
| U.S. Virgin Islanders | 0.0 /100 | #295 | Tragic 6.3% |
| Ute | 0.0 /100 | #296 | Tragic 6.3% |
| Jamaicans | 0.0 /100 | #297 | Tragic 6.3% |
| Immigrants | Haiti | 0.0 /100 | #298 | Tragic 6.3% |
| Immigrants | West Indies | 0.0 /100 | #299 | Tragic 6.3% |
| Immigrants | Trinidad and Tobago | 0.0 /100 | #300 | Tragic 6.3% |
| Trinidadians and Tobagonians | 0.0 /100 | #301 | Tragic 6.3% |